Office Depot 2004 Annual Report Download - page 67
Download and view the complete annual report
Please find page 67 of the 2004 Office Depot annual report below. You can navigate through the pages in the report by either clicking on the pages listed below, or by using the keyword search tool below to find specific information within the annual report.-
 1
1 -
2
-
3
-
4
-
5
-
6
-
7
-
8
-
9
-
10
-
11
-
12
-
13
-
14
-
15
-
16
-
17
-
18
-
19
-
20
-
21
-
22
-
23
-
24
-
25
-
26
-
27
-
28
-
29
-
30
-
31
-
32
-
33
-
34
-
35
-
36
-
37
-
38
-
39
-
40
-
41
-
42
-
43
-
44
-
45
-
46
-
47
-
48
-
49
-
50
-
51
-
52
-
53
-
54
-
55
-
56
-
 57
57 -
 58
58 -
 59
59 -
 60
60 -
 61
61 -
 62
62 -
 63
63 -
 64
64 -
 65
65 -
 66
66 -
 67
67 -
 68
68 -
 69
69 -
 70
70 -
 71
71 -
 72
72 -
 73
73 -
 74
74 -
 75
75 -
 76
76 -
 77
77 -
78
-
79
-
80
-
81
-
82
 |
 |

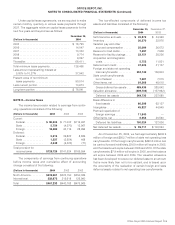
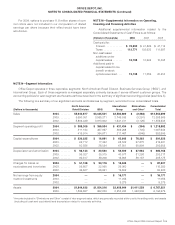
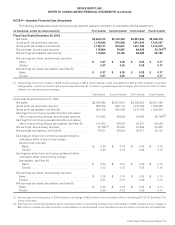
NOTE M—Supplemental Information on Operating,
Investing and Financing Activities
Additional supplemental information related to the
Consolidated Statements of Cash Flows is as follows:
(Dollars in thousands) 2004 2003 2002
Cash paid for:
Interest . . . . . . . . . . . . $ 78,590 $ 41,869 $ 47,114
Taxes . . . . . . . . . . . . . 112,771 102,623 111,597
Non-cash asset
additions under
capital leases . . . . . . . 18,798 10,664 10,395
Additional paid-in
capital related to tax
benefit on stock
options exercised . . . . 12,138 11,059 20,453
Office Depot 2004 Annual Report |65
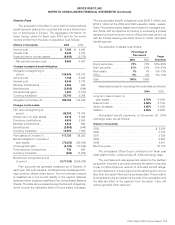
For 2004, options to purchase 11.8 million shares of com-
mon stock were not included in our computation of diluted
earnings per share because their effect would have been
anti-dilutive.
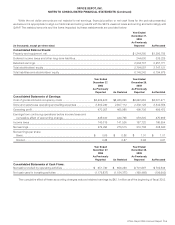
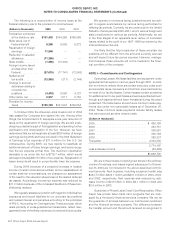
NOTE N—Segment Information
Office Depot operates in three reportable segments: North American Retail Division, Business Services Group (“BSG”), and
International Group. Each of these segments is managed separately primarily because it serves different customer groups. The
accounting policies for each segment are the same as those described in the summary of significant accounting policies (see Note A).
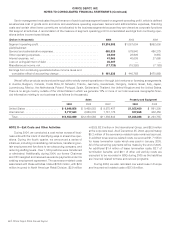
The following is a summary of our significant accounts and balances by segment, reconciled to our consolidated totals.
North American International Eliminations Consolidated
(Dollars in thousands) Retail Division BSG Group and Other* Total
Sales 2004 ........ $5,940,677 $4,045,501 $3,580,809 $ (2,288) $13,564,699
2003 . . . . . . . . 5,650,051 3,965,271 2,746,535 (3,291) 12,358,566
2002 . . . . . . . . 5,804,449 3,913,902 1,641,411 (3,129) 11,356,633
Segment operating profit 2004 ........ $ 388,308 $ 399,534 $ 431,434 $ (394) $ 1,218,882
2003 ........ 311,184 387,867 369,288 (705) 1,067,634
2002 . . . . . . . . 416,914 364,871 211,467 (646) 992,606
Capital expenditures 2004 ........ $ 230,225 $ 16,891 $ 65,843 $ 78,263 $ 391,222
2003 . . . . . . . . 62,712 17,362 68,532 67,875 216,481
2002 ........ 50,586 28,524 67,551 55,994 202,655
Depreciation and amortization 2004 ........ $ 98,143 $ 30,530 $ 52,509 $ 87,984 $ 269,166
2003 . . . . . . . . 96,027 35,315 40,577 81,298 253,217
2002 . . . . . . . . 92,817 39,208 16,963 56,187 205,175
Charges for losses on 2004 ........ $ 51,108 $ 20,176 $ 16,643 — $ 87,927
receivables and inventories 2003 ........ 56,857 32,065 29,360 — 118,282
2002 ........ 36,627 36,991 19,602 — 93,220
Net earnings from equity 2004 ........ — — $ 16,171 — $ 16,171
method investments 2003 . . . . . . . . — — 11,056 — 11,056
2002 ........ — — 9,279 — 9,279
Assets 2004 ........ $1,844,632 $1,054,216 $2,456,944 $1,411,559 $ 6,767,351
2003 ........ 1,599,697 992,830 2,253,243 1,348,909 6,194,679
*Amounts included in “Eliminations and Other” consist of inter-segment sales, which are generally recorded at the cost to the selling entity, and assets
(including all cash and equivalents) and depreciation related to corporate activities.
OFFICE DEPOT, INC.
NOTES TO CONSOLIDATED FINANCIAL STATEMENTS (Continued)