Office Depot 2004 Annual Report Download - page 21
Download and view the complete annual report
Please find page 21 of the 2004 Office Depot annual report below. You can navigate through the pages in the report by either clicking on the pages listed below, or by using the keyword search tool below to find specific information within the annual report.-
 1
1 -
2
-
3
-
4
-
5
-
6
-
7
-
8
-
9
-
10
-
 11
11 -
 12
12 -
 13
13 -
 14
14 -
 15
15 -
 16
16 -
 17
17 -
 18
18 -
 19
19 -
 20
20 -
 21
21 -
 22
22 -
 23
23 -
 24
24 -
 25
25 -
 26
26 -
 27
27 -
 28
28 -
 29
29 -
 30
30 -
 31
31 -
32
-
33
-
34
-
35
-
36
-
37
-
38
-
39
-
40
-
41
-
42
-
43
-
44
-
45
-
46
-
47
-
48
-
49
-
50
-
51
-
52
-
53
-
54
-
55
-
56
-
57
-
58
-
59
-
60
-
61
-
62
-
63
-
64
-
65
-
66
-
67
-
68
-
69
-
70
-
71
-
72
-
73
-
74
-
75
-
76
-
77
-
78
-
79
-
80
-
81
-
82
 |
 |

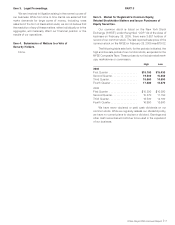
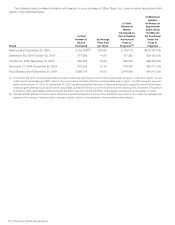
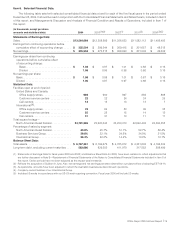
Item 6. Selected Financial Data.
The following table sets forth selected consolidated financial data at and for each of the five fiscal years in the period ended
December 25, 2004. It should be read in conjunction with the Consolidated Financial Statements and Notes thereto, included in Item 8
of this report, and Management’s Discussion and Analysis of Financial Condition and Results of Operations, included in Item 7 of
this report.
(In thousands, except per share
amounts and statistical data) 2004 2003(1)(2) 2002(1) 2001(3) 2000(3)(5)
Statements of Earnings Data:
Sales. . . . . . . . . . . . . . . . . . . . . . . . . . . . . . . . . . . $13,564,699 $12,358,566 $11,356,633 $11,082,112 $11,495,493
Earnings from continuing operations before
cumulative effect of accounting change . . . . . $ 335,504 $ 299,244 $ 309,415 $ 201,657 $ 48,315
Net earnings . . . . . . . . . . . . . . . . . . . . . . . . . . . . . $ 335,504 $ 273,515 $ 308,640 $ 201,043 $ 49,332
Earnings per share from continuing
operations before cumulative effect
of accounting change:
Basic. . . . . . . . . . . . . . . . . . . . . . . . . . . . . . . $1.08$ 0.97 $ 1.01 $ 0.68 $ 0.16
Diluted . . . . . . . . . . . . . . . . . . . . . . . . . . . . . 1.06 0.95 0.98 0.66 0.16
Net earnings per share:
Basic. . . . . . . . . . . . . . . . . . . . . . . . . . . . . . . . . $1.08$ 0.88 $ 1.01 $ 0.67 $ 0.16
Diluted . . . . . . . . . . . . . . . . . . . . . . . . . . . . . . . 1.06 0.87 0.97 0.66 0.16
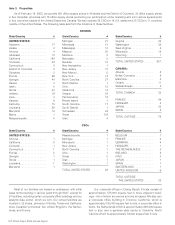
Statistical Data:
Facilities open at end of period:
United States and Canada:
Office supply stores................... 969 900 867 859 888
Customer service centers . . . . . . . . . . . . . . 22 22 24 24 25
Call centers ......................... 13 13 13 13 7
International(4):
Office supply stores . . . . . . . . . . . . . . . . . . . 78 64 50 39 35
Customer service centers .............. 25 25 15 14 12
Call centers ......................... 31 31 13 11 11
Total square footage—
North American Retail Division............. 24,791,255 23,620,343 23,203,013 22,842,403 24,384,355
Percentage of sales by segment:
North American Retail Division. . . . . . . . . . . . . 43.8% 45.7% 51.1% 52.7% 56.4%
Business Services Group................. 29.8% 32.1% 34.5% 34.0% 31.5%
International Group. . . . . . . . . . . . . . . . . . . . . . 26.4% 22.2% 14.4% 13.3% 12.1%
Balance Sheet Data:
Total assets. . . . . . . . . . . . . . . . . . . . . . . . . . . . . . $ 6,767,351 $ 6,194,679 $ 4,765,812 $ 4,331,643 $ 4,196,334
Long-term debt, excluding current maturities . . . 583,680 829,302 411,970 317,552 598,499
(1) Statements of Earnings Data for fiscal years 2003 and 2002, and Balance Sheet Data for 2003, have been restated to reflect adjustments that
are further discussed in Note B—Restatement of Financial Statements of the Notes to Consolidated Financial Statements included in Item 8 of
this report. Earlier periods have not been adjusted as the impact was immaterial.
(2) Reflects the acquisition of Guilbert in June. Also, net earnings and net earnings per share data reflect cumulative effect of adopting EITF 02-16.
(3) As applicable, amounts have been adjusted to reflect the Australian business as discontinued operations.
(4) Company-owned facilities of our International Group.
(5) Includes 53 weeks in accordance with our 52–53 week reporting convention. Fiscal year 2005 will include 53 weeks.
Office Depot 2004 Annual Report |19