Office Depot 2004 Annual Report Download - page 25
Download and view the complete annual report
Please find page 25 of the 2004 Office Depot annual report below. You can navigate through the pages in the report by either clicking on the pages listed below, or by using the keyword search tool below to find specific information within the annual report.-
 1
1 -
2
-
3
-
4
-
5
-
6
-
7
-
8
-
9
-
10
-
11
-
12
-
13
-
14
-
 15
15 -
 16
16 -
 17
17 -
 18
18 -
 19
19 -
 20
20 -
 21
21 -
 22
22 -
 23
23 -
 24
24 -
 25
25 -
 26
26 -
 27
27 -
 28
28 -
 29
29 -
 30
30 -
 31
31 -
 32
32 -
 33
33 -
 34
34 -
 35
35 -
36
-
37
-
38
-
39
-
40
-
41
-
42
-
43
-
44
-
45
-
46
-
47
-
48
-
49
-
50
-
51
-
52
-
53
-
54
-
55
-
56
-
57
-
58
-
59
-
60
-
61
-
62
-
63
-
64
-
65
-
66
-
67
-
68
-
69
-
70
-
71
-
72
-
73
-
74
-
75
-
76
-
77
-
78
-
79
-
80
-
81
-
82
 |
 |

The Financial Accounting Standards Board (“FASB”) has
issued a new accounting pronouncement that will require com-
panies to expense the fair value of stock options granted to
employees. This rule will be applicable for all public companies
beginning with the third quarter of 2005. Because we currently
provide stock options to a large number of our employees, this
change could have a significant impact on our results in 2005
and beyond. Our assessment of this rule change is not yet
complete, but our financial statement footnote disclosures have
indicated that under one acceptable methodology for valuing
stock option grants, the full year impact of expensing stock
options in recent years would have reduced EPS in the range
of $0.06 to $0.09 per share. We anticipate refining our analysis
during the first half of 2005.
Corporate and other items not classified within our three
main segments are addressed below following the discussions
of segment results.
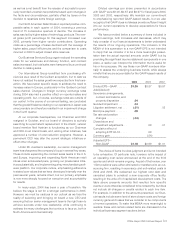
The Overall results table provides a subtotal for segment
operating profit. We use this measure of performance to assess
the operations of each business unit, and we believe it is use-
ful to investors because it reflects the sales and operating
expenses directly related to the segment’s activities. Our gen-
eral and administrative expenses primarily consist of personnel
and related costs associated with support functions. Because
these functions typically support all segments of our business,
we have historically not considered these costs in determining
our segment profitability, but rather have applied this expense
when looking at total company profitability. Other companies
may charge more or less general and administrative costs
to their segments, and our presentation therefore may not
be comparable to similarly titled measurements used by
some other entities. Our measure of segment operating profit
should not be considered as an alternative to operating income
or net earnings determined in accordance with GAAP. The table
above reconciles segment operating profit to operating profit
determined in accordance with GAAP.
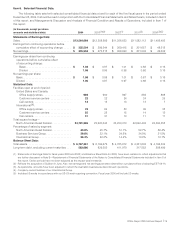
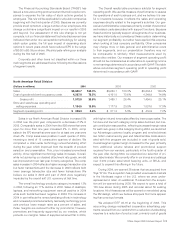
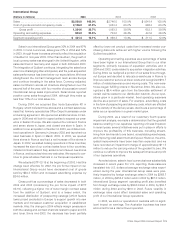
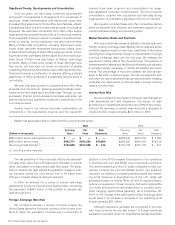
North American Retail Division
(Dollars in millions) 2004 2003 2002
Sales. . . . . . . . . . . . . . . . . . . . . . . . . . . . . . . . . $5,940.7 100.0% $5,650.1 100.0% $5,804.4 100.0%
Cost of goods sold and occupancy costs . . . . 4,367.9 73.5% 4,161.0 73.6% 4,349.9 74.9%
Gross profit . . . . . . . . . . . . . . . . . . . . . . . 1,572.8 26.5% 1,489.1 26.4% 1,454.5 25.1%
Store and warehouse operating and
selling expenses. . . . . . . . . . . . . . . . . . . . . . 1,184.5 19.9% 1,177.9 20.9% 1,037.6 17.9%
Segment operating profit ................. $ 388.3 6.6% $ 311.2 5.5% $ 416.9 7.2%
Sales in our North American Retail Division increased 5%
in 2004 over the prior year, compared to a decrease of 3% in
2003. Comparable sales in 2004 from the 892 stores that were
open for more than one year increased 3%. In 2003, comp
sales in the 870 stores that were open for at least one year were
down 4%. Comp sales were positive in each quarter of 2004,
reversing a trend of 15 consecutive quarters of decline. We
completed a chain-wide technology remerchandising effort
during the year, which improved both the breadth of product
selection and presentation. This, plus increased promotional
activity, drove significant technology sales increases. Overall,
while not achieving our desired attachment rate goals, we did
see improvement over last year in many categories. The comp
sales increase in 2004 reflects a higher average transaction size
but fewer transactions and the decrease in 2003 reflects both
lower average transaction size and fewer transactions. We
believe our sales in 2002 and part of 2003 were negatively
impacted by the overall soft U.S. economy at that time.
The overall technology products category increased 13%
in 2004, following an 11% decline in 2003. Sales of desktops,
laptops, and networking equipment were all positive in 2004
while such trends had been negative in 2003. The increase in
2004 in part reflects the remerchandising efforts in technology
and increased promotional activity. Generally, technology prod-
ucts produce lower margin rates as a percent of sales, and
those margins are reduced further by promotions; however,
promotions are frequently supported by our vendors, which
protects our margins. Sales of supplies remained flat in 2004,
with higher ink and toner sales offset by lower paper sales. The
furniture and low tech category comp sales declined, but mar-
gin contribution was positive, reflecting increased margin rates
for each sub-group in this category. During 2004, we launched
our Advantage customer loyalty program and enrolled almost
two million customers by year end. Merchandise costs associ-
ated with this program are included in cost of goods sold.
Overall segment gross margin increased for the year, primarily
from additional volume rebates and promotional support
received from our vendors, particularly in the fourth quarter of
the year. Also during 2004, we expanded our selection of pri-
vate label brands. We currently offer in our stores and catalogs
over 3,000 private label stock keeping units, or SKUs, and
expect to expand this offering in the future.
During 2004, we opened 36 stores that we acquired from
Toys “R” Us. The acquisition has provided us access to markets
in the Northeast region of the U.S. where we were under-
represented in retail. An additional 15 stores from the acquisi-
tion will be opened during 2005. We expect to open a total of
100 new stores during 2005 and remodel about 50 existing
locations. All of these stores will be opened or remodeled using
the M2 design, which we believe shoppers find more appeal-
ing than previous formats.
We adopted EITF 02-16 at the beginning of 2003. This
accounting change reclassified cooperative advertising pay-
ments received from our vendors from a reduction of advertising
expense to a reduction of product cost, primarily cost of goods
Office Depot 2004 Annual Report |23