NVIDIA 2008 Annual Report Download - page 86
Download and view the complete annual report
Please find page 86 of the 2008 NVIDIA annual report below. You can navigate through the pages in the report by either clicking on the pages listed below, or by using the keyword search tool below to find specific information within the annual report.-
 1
1 -
2
-
3
-
4
-
5
-
6
-
7
-
8
-
9
-
10
-
11
-
12
-
13
-
14
-
15
-
16
-
17
-
18
-
19
-
20
-
21
-
22
-
23
-
24
-
25
-
26
-
27
-
28
-
29
-
30
-
31
-
32
-
33
-
34
-
35
-
36
-
37
-
38
-
39
-
40
-
41
-
42
-
43
-
44
-
45
-
46
-
47
-
48
-
49
-
50
-
51
-
52
-
53
-
54
-
55
-
56
-
57
-
58
-
59
-
60
-
61
-
62
-
63
-
64
-
65
-
66
-
67
-
68
-
69
-
70
-
71
-
72
-
73
-
74
-
75
-
 76
76 -
 77
77 -
 78
78 -
 79
79 -
 80
80 -
 81
81 -
 82
82 -
 83
83 -
 84
84 -
 85
85 -
 86
86 -
 87
87 -
 88
88 -
 89
89 -
 90
90 -
 91
91 -
 92
92 -
 93
93 -
 94
94 -
 95
95 -
 96
96 -
97
-
98
-
99
-
100
-
101
-
102
-
103
-
104
-
105
-
106
-
107
-
108
-
109
-
110
-
111
-
112
-
113
-
114
-
115
-
116
-
117
-
118
-
119
-
120
-
121
-
122
-
123
-
124
 |
 |

NVIDIA CORPORATION AND SUBSIDIARIES
NOTES TO THE CONSOLIDATED FINANCIAL STATEMENTS
(Continued)
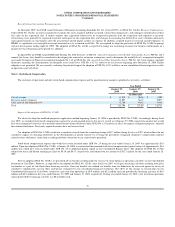
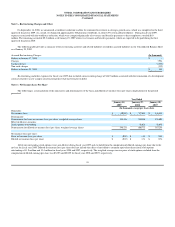
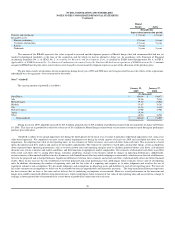
Note 3 – Restructuring Charges and Other
On September 18, 2008, we announced a workforce reduction to allow for continued investment in strategic growth areas, which was completed in the third
quarter of fiscal year 2009. As a result, we eliminated approximately 360 positions worldwide, or about 6.5% of our global workforce. During fiscal year 2009,
expenses associated with the workforce reduction, which were comprised primarily of severance and benefits payments to these employees, totaled $8.0
million. The remaining accrual of $0.2 million as of January 25, 2009 relates to severance and benefits payments, which are expected to be paid during the first
quarter of fiscal year 2010.
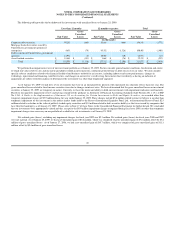
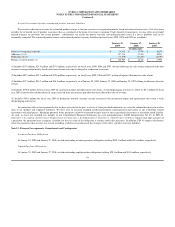
The following table provides a summary of the restructuring activities and related liabilities recorded in accrued liabilities in our Consolidated Balance Sheet
as of January 25, 2009:
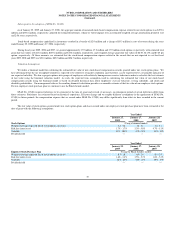
Restructuring and other expenses for fiscal year 2009 also included a non
-
recurring charge of $18.9 million associated with the termination of a development
contract related to a new campus construction project that has been put on hold.
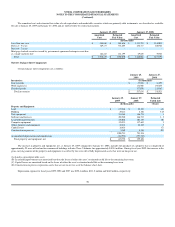
Note 4 – Net Income (Loss) Per Share
The following is a reconciliation of the numerators and denominators of the basic and diluted net income (loss) per share computations for the periods
presented:
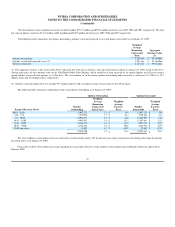
All of our outstanding stock options were anti
-
dilutive during fiscal year 2009 and excluded from the computation of diluted earnings per share due to the
net loss for fiscal year 2009. Diluted net income (loss) per share does not include the effect of anti
-
dilutive common equivalent shares from stock options
outstanding of 11.9 million and 13.4 million for fiscal years 2008 and 2007, respectively. The weighted average exercise price of stock options excluded from the
computation of diluted earnings per share was $32.05 and $20.09 for fiscal years 2008 and 2007, respectively.
Accrued Restructuring Charges :
(In thousands)
Balance at January 27, 2008
$
-
Charges
7,956
Cash payments
(7,440
)
Non
-
cash charges
(330
)
Balance at January 25, 2009
$
186
Year Ended
January 25,
2009
January 27,
2008
January 28,
2007
(In thousands, except per share data)
Numerator:
Net income (loss)
$
(30,041
)
$
797,645
$
448,834
Denominator:
Denominator for basic net income (loss) per share, weighted average shares
548,126
550,108
528,606
Effect of dilutive securities:
Stock options outstanding
-
56,624
58,650
Denominator for diluted net income (loss) per share, weighted average shares
548,126
606,732
587,256
Net income (loss) per share:
Basic net income (loss) per share
$
(0.05
)
$
1.45
$
0.85
Diluted net income (loss) per share
$
(0.05
)
$
1.31
$
0.76
83