NVIDIA 2008 Annual Report Download - page 108
Download and view the complete annual report
Please find page 108 of the 2008 NVIDIA annual report below. You can navigate through the pages in the report by either clicking on the pages listed below, or by using the keyword search tool below to find specific information within the annual report.-
 1
1 -
2
-
3
-
4
-
5
-
6
-
7
-
8
-
9
-
10
-
11
-
12
-
13
-
14
-
15
-
16
-
17
-
18
-
19
-
20
-
21
-
22
-
23
-
24
-
25
-
26
-
27
-
28
-
29
-
30
-
31
-
32
-
33
-
34
-
35
-
36
-
37
-
38
-
39
-
40
-
41
-
42
-
43
-
44
-
45
-
46
-
47
-
48
-
49
-
50
-
51
-
52
-
53
-
54
-
55
-
56
-
57
-
58
-
59
-
60
-
61
-
62
-
63
-
64
-
65
-
66
-
67
-
68
-
69
-
70
-
71
-
72
-
73
-
74
-
75
-
76
-
77
-
78
-
79
-
80
-
81
-
82
-
83
-
84
-
85
-
86
-
87
-
88
-
89
-
90
-
91
-
92
-
93
-
94
-
95
-
96
-
97
-
 98
98 -
 99
99 -
 100
100 -
 101
101 -
 102
102 -
 103
103 -
 104
104 -
 105
105 -
 106
106 -
 107
107 -
 108
108 -
 109
109 -
 110
110 -
 111
111 -
 112
112 -
 113
113 -
 114
114 -
 115
115 -
 116
116 -
 117
117 -
 118
118 -
119
-
120
-
121
-
122
-
123
-
124
 |
 |

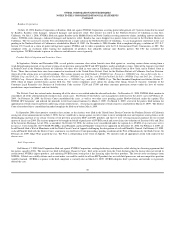
NVIDIA CORPORATION AND SUBSIDIARIES
NOTES TO THE CONSOLIDATED FINANCIAL STATEMENTS
(Continued)
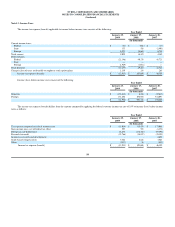
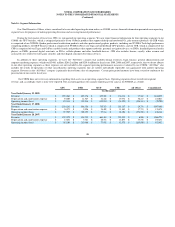
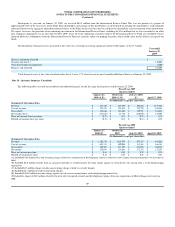
Revenue by geographic region is allocated to individual countries based on the location to which the products are initially billed even if our customers
’
revenue is attributable to end customers that are located in a different location. The following tables summarize information pertaining to our revenue from
customers based on invoicing address in different geographic regions:
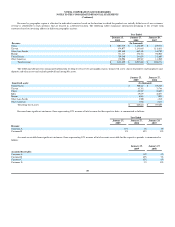
The following table presents summarized information for long
-
lived assets by geographic region. Long lived assets consist of property and equipment and
deposits and other assets and exclude goodwill and intangible assets.
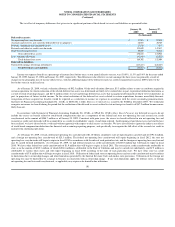
Revenue from significant customers, those representing 10% or more of total revenue for the respective dates, is summarized as follows:
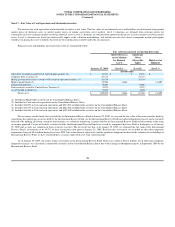
Accounts receivable from significant customers, those representing 10% or more of total accounts receivable for the respective periods, is summarized as
follows:
Year Ended
January 25,
2009
January 27,
2008
January 28,
2007
Revenue:
(In thousands)
China
$
1,087,739
$
1,256,209
$
659,711
Taiwan
974,077
1,293,645
1,118,631
Other Asia Pacific
601,480
662,448
544,700
Europe
321,117
438,321
302,080
United States
309,540
341,670
332,609
Other Americas
130,906
105,567
111,040
Total revenue
$
3,424,859
$
4,097,860
$
3,068,771
January 25,
2009
January 27,
2008
Long
-
lived assets:
(In thousands)
United States
$
500,162
$
298,765
Taiwan
81,761
31,788
China
42,969
24,655
India
29,639
28,677
Europe
6,865
7,052
Other Asia Pacific
2,500
1,510
Other Americas
1,928
5,412
Total long
-
lived assets
$
665,824
$
397,859
Year Ended
January 25,
2009
January 27,
2008
January 28,
2007
Revenue:
Customer A
11
%
7
%
5
%
Customer B
8
%
10
%
12
%
January 25,
2009
January 27,
2008
Accounts Receivable:
Customer A
18
%
4
%
Customer B
10
%
9
%
Customer C
10
%
8
%
Customer D
2
%
12
%
105