NVIDIA 2008 Annual Report Download - page 82
Download and view the complete annual report
Please find page 82 of the 2008 NVIDIA annual report below. You can navigate through the pages in the report by either clicking on the pages listed below, or by using the keyword search tool below to find specific information within the annual report.-
 1
1 -
2
-
3
-
4
-
5
-
6
-
7
-
8
-
9
-
10
-
11
-
12
-
13
-
14
-
15
-
16
-
17
-
18
-
19
-
20
-
21
-
22
-
23
-
24
-
25
-
26
-
27
-
28
-
29
-
30
-
31
-
32
-
33
-
34
-
35
-
36
-
37
-
38
-
39
-
40
-
41
-
42
-
43
-
44
-
45
-
46
-
47
-
48
-
49
-
50
-
51
-
52
-
53
-
54
-
55
-
56
-
57
-
58
-
59
-
60
-
61
-
62
-
63
-
64
-
65
-
66
-
67
-
68
-
69
-
70
-
71
-
 72
72 -
 73
73 -
 74
74 -
 75
75 -
 76
76 -
 77
77 -
 78
78 -
 79
79 -
 80
80 -
 81
81 -
 82
82 -
 83
83 -
 84
84 -
 85
85 -
 86
86 -
 87
87 -
 88
88 -
 89
89 -
 90
90 -
 91
91 -
 92
92 -
93
-
94
-
95
-
96
-
97
-
98
-
99
-
100
-
101
-
102
-
103
-
104
-
105
-
106
-
107
-
108
-
109
-
110
-
111
-
112
-
113
-
114
-
115
-
116
-
117
-
118
-
119
-
120
-
121
-
122
-
123
-
124
 |
 |

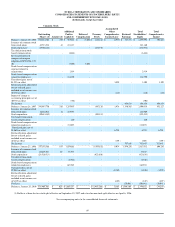
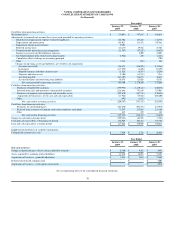
NVIDIA CORPORATION AND SUBSIDIARIES
NOTES TO THE CONSOLIDATED FINANCIAL STATEMENTS
(Continued)
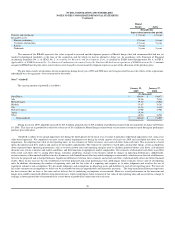
Subsequent to the adoption of SFAS No. 123(R)
As of January 25, 2009 and January 27, 2008, the aggregate amount of unearned stock
-
based compensation expense related to our stock options was $193.8
million and $233.6 million, respectively, adjusted for estimated forfeitures, which we will recognize over an estimated weighted average amortization period of 1.82
and 2.08 years, respectively.
Stock
-
based compensation capitalized in inventories resulted in a benefit of $2.0 million and a charge of $0.3 million in cost of revenue during the years
ended January 25, 2009 and January 27, 2008, respectively.
During fiscal years 2009, 2008 and 2007, we granted approximately 17.9 million, 17.2 million and 17.9 million stock options, respectively, with estimated total
grant
-
date fair values of $143.6 million, $207.4 million and $138.4 million, respectively, and weighted average grant
-
date fair values of $8.03, $11.98 and $7.85 per
option, respectively. Of these amounts, we estimated that the stock
-
based compensation expense related to the awards that are not expected to vest for fiscal
years 2009, 2008 and 2007 was $23.8 million, $40.0 million and $26.7 million, respectively.
Valuation Assumptions
We utilize a binomial model for calculating the estimated fair value of new stock
-
based compensation awards granted under our stock option plans. We
have determined that the use of implied volatility is expected to be reflective of market conditions and, therefore, can be expected to be a reasonable indicator of
our expected volatility. We also segregate options into groups of employees with relatively homogeneous exercise behavior in order to calculate the best estimate
of fair value using the binomial valuation model. As such, the expected term assumption used in calculating the estimated fair value of our stock
-
based
compensation awards using the binomial model is based on detailed historical data about employees' exercise behavior, vesting schedules, and death and
disability probabilities. Our management believes the resulting binomial calculation provides a reasonable estimate of the fair value of our employee stock options.
For our employee stock purchase plan we continue to use the Black
-
Scholes model.
SFAS No. 123(R) requires forfeitures to be estimated at the time of grant and revised, if necessary, in subsequent periods if actual forfeitures differ from
those estimates. Forfeitures are estimated based on historical experience. If factors change and we employ different assumptions in the application of SFAS No.
123(R) in future periods, the compensation expense that we record under SFAS No. 123(R) may differ significantly from what we have recorded in the current
period.
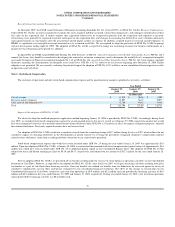
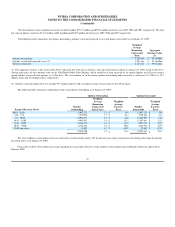
The fair value of stock options granted under our stock option plans and shares issued under our employee stock purchase plan have been estimated at the
date of grant with the following assumptions:
Year Ended
January 25,
2009
January 27,
2008
January 28,
2007
Stock Options
(Using a binomial model)
Weighted average expected life of stock options (in years)
3.6
-
5.8
3.8
-
5.8
3.6
-
5.1
Risk free interest rate
1.7%
-
3.7
%
3.3%
-
5.0
%
4.7%
-
5.1
%
Volatility
52%
-
105
%
37%
-
54
%
39%
-
51
%
Dividend yield
—
—
—
Year Ended
January 25,
2009
January 27,
2008
January 28,
2007
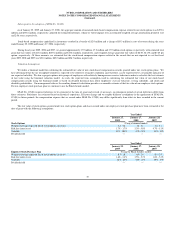
Employee Stock Purchase Plan
(Using the Black
-
Scholes model)
Weighted average expected life of stock options (in years)
0.5
-
2.0
0.5
-
2.0
0.5
-
2.0
Risk free interest rate
1.6%
-
2.4
%
3.5%
-
5.2
%
1.6%
-
5.2
%
Volatility
62%
-
68
%
38%
-
54
%
30%
-
47
%
Dividend yield
—
—
—
79