NVIDIA 2008 Annual Report Download - page 54
Download and view the complete annual report
Please find page 54 of the 2008 NVIDIA annual report below. You can navigate through the pages in the report by either clicking on the pages listed below, or by using the keyword search tool below to find specific information within the annual report.-
 1
1 -
2
-
3
-
4
-
5
-
6
-
7
-
8
-
9
-
10
-
11
-
12
-
13
-
14
-
15
-
16
-
17
-
18
-
19
-
20
-
21
-
22
-
23
-
24
-
25
-
26
-
27
-
28
-
29
-
30
-
31
-
32
-
33
-
34
-
35
-
36
-
37
-
38
-
39
-
40
-
41
-
42
-
43
-
 44
44 -
 45
45 -
 46
46 -
 47
47 -
 48
48 -
 49
49 -
 50
50 -
 51
51 -
 52
52 -
 53
53 -
 54
54 -
 55
55 -
 56
56 -
 57
57 -
 58
58 -
 59
59 -
 60
60 -
 61
61 -
 62
62 -
 63
63 -
 64
64 -
65
-
66
-
67
-
68
-
69
-
70
-
71
-
72
-
73
-
74
-
75
-
76
-
77
-
78
-
79
-
80
-
81
-
82
-
83
-
84
-
85
-
86
-
87
-
88
-
89
-
90
-
91
-
92
-
93
-
94
-
95
-
96
-
97
-
98
-
99
-
100
-
101
-
102
-
103
-
104
-
105
-
106
-
107
-
108
-
109
-
110
-
111
-
112
-
113
-
114
-
115
-
116
-
117
-
118
-
119
-
120
-
121
-
122
-
123
-
124
 |
 |

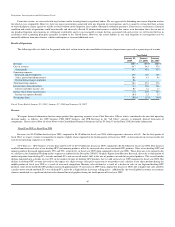
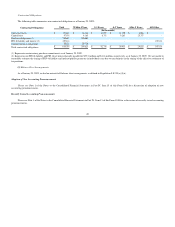
Revenue from significant customers, those representing approximately 10% or more of total revenue for the respective periods, is summarized as follows:
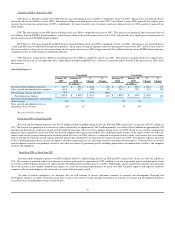
Gross Profit and Gross Margin
Gross profit consists of total revenue, net of allowances, less cost of revenue. Cost of revenue consists primarily of the cost of semiconductors purchased
from subcontractors, including wafer fabrication, assembly, testing and packaging, manufacturing support costs, including labor and overhead associated with
such purchases, final test yield fallout, inventory and warranty provisions, and shipping costs. Cost of revenue also includes development costs for license and
service arrangements.
Gross margin is the percentage of gross profit to revenue. Our gross margin was 34.3%, 45.6% and 42.4% for fiscal years 2009, 2008 and 2007,
respectively. Our gross margin is significantly impacted by the mix of products we sell. Product mix is often difficult to estimate with accuracy. Therefore, if we
experience product transition or competitive challenges, if we achieve significant revenue growth in our lower margin product lines, or if we are unable to earn as
much revenue as we expect from higher margin product lines, our gross margin may be negatively impacted.
We will continue to focus on improving our gross margin by delivering cost effective product architectures, enhancing business processes and delivering
profitable growth. A discussion of our gross margin results for each of our operating segments is as follows:
Fiscal Year 2009 vs. Fiscal Year 2008
Our gross margin declined to 34.3% in fiscal year 2009 from 45.6% for fiscal year 2008. The gross margin for fiscal year 2009 includes the impact of a $196.0
million charge against cost of revenue to cover anticipated customer warranty, repair, return, replacement and associated costs arising from a weak die/packaging
material set in certain versions of our previous generation MCP and GPU products used in notebook systems offset by allocated insurance claim proceeds of $6.7
million from an insurance provider. This warranty charge had an adverse impact of approximately 6.0% on our gross margin for fiscal year 2009. Additionally,
inventory reserves taken during fiscal year 2009 were approximately $50.0 million higher compared to fiscal year 2008, reflecting a significant decline in our
forecasted future demand for the related products and having a negative impact on our gross margin.
GPU Business. The gross margin of our GPU business decreased during fiscal year 2009 as compared to fiscal year 2008. This decrease was due to a charge
against cost of revenue to cover anticipated customer warranty, repair, return, replacement and associated costs arising from a weak die/packaging material set in
certain versions of our previous generation GPU products used in notebook systems, the negative impact of inventory reserves taken during the fourth quarter of
fiscal year 2009, and average sales price regression in our GeForce 9
-
based and previous generations of desktop products resulting from increased competition.
The average sales price regression was also driven by a combination of market migration from desktop PCs towards notebook PCs and an overall market shift in
the mix of products towards lower priced products.
PSB. The gross margin of our PSB increased slightly during fiscal year 2009 as compared to fiscal year 2008. This increase was primarily due to increased
sales of our GeForce 9
-
based NVIDIA Quadro products, which began selling in the fourth quarter of fiscal year 2008, and GeForce 8
-
based NVIDIA Quadro
products, which generally have higher gross margins than our previous generations of NVIDIA Quadro products.
MCP Business. The gross margin of our MCP business decreased during fiscal year 2009 as compared to fiscal year 2008, due to decline in the margins of
our AMD and Intel
-
based products. During fiscal year 2009, gross margins declined primarily due to a charge against cost of revenue to cover anticipated
customer warranty, repair, return, replacement and associated costs arising from a weak die/packaging material set in certain versions of our previous generation
MCP products used in notebook systems.
CPB. The gross margin of our CPB increased during fiscal year 2009 as compared to fiscal year 2008. This increase was primarily due to changes in the
product mix in our CPB product lines. We experienced greater revenue decline in our lower margin cell phone and other handheld devices product lines as
compared to higher margin SCE transactions in the current year.
Year Ended
January 25,
2009
January 27,
2008
January 28,
2007
Revenue:
Customer A
11
%
7
%
4
%
Customer B
8
%
10
%
12
%
51