NVIDIA 2008 Annual Report Download - page 104
Download and view the complete annual report
Please find page 104 of the 2008 NVIDIA annual report below. You can navigate through the pages in the report by either clicking on the pages listed below, or by using the keyword search tool below to find specific information within the annual report.-
 1
1 -
2
-
3
-
4
-
5
-
6
-
7
-
8
-
9
-
10
-
11
-
12
-
13
-
14
-
15
-
16
-
17
-
18
-
19
-
20
-
21
-
22
-
23
-
24
-
25
-
26
-
27
-
28
-
29
-
30
-
31
-
32
-
33
-
34
-
35
-
36
-
37
-
38
-
39
-
40
-
41
-
42
-
43
-
44
-
45
-
46
-
47
-
48
-
49
-
50
-
51
-
52
-
53
-
54
-
55
-
56
-
57
-
58
-
59
-
60
-
61
-
62
-
63
-
64
-
65
-
66
-
67
-
68
-
69
-
70
-
71
-
72
-
73
-
74
-
75
-
76
-
77
-
78
-
79
-
80
-
81
-
82
-
83
-
84
-
85
-
86
-
87
-
88
-
89
-
90
-
91
-
92
-
93
-
 94
94 -
 95
95 -
 96
96 -
 97
97 -
 98
98 -
 99
99 -
 100
100 -
 101
101 -
 102
102 -
 103
103 -
 104
104 -
 105
105 -
 106
106 -
 107
107 -
 108
108 -
 109
109 -
 110
110 -
 111
111 -
 112
112 -
 113
113 -
 114
114 -
115
-
116
-
117
-
118
-
119
-
120
-
121
-
122
-
123
-
124
 |
 |

NVIDIA CORPORATION AND SUBSIDIARIES
NOTES TO CONSOLIDATED FINANCIAL STATEMENTS
(Continued)
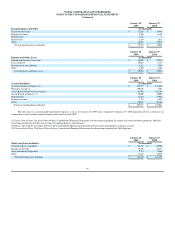
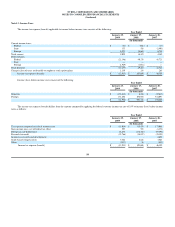
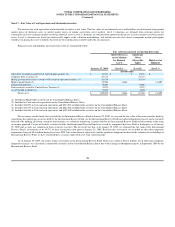
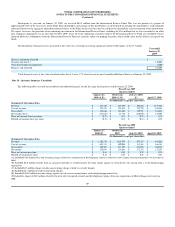
The tax effect of temporary differences that gives rise to significant portions of the deferred tax assets and liabilities are presented below:
Income tax expense (benefit) as a percentage of income (loss) before taxes, or our annual effective tax rate, was (30.0%), 11.5% and 9.4% for the years ended
January 25, 2009, January 27, 2008 and January 28, 2007, respectively. The difference in the effective tax rates amongst the three years was primarily a result of
changes in our geographic mix of income subject to tax, with the additional impact of the federal research tax credit recognized in fiscal year 2009 relative to the
loss before taxes in such fiscal year.
As of January 25, 2009, we had a valuation allowance of $92.5 million. Of the total valuation allowance, $5.3 million relates to state tax attributes acquired in
certain acquisitions for which realization of the related deferred tax assets was determined not likely to be realized due, in part, to potential utilization limitations as
a result of stock ownership changes, and $87.2 million relates to state and foreign deferred tax assets that management determined not likely to be realized due, in
part, to projections of future taxable income. To the extent realization of the deferred tax assets related to certain acquisitions becomes more
-
likely
-
than
-
not,
recognition of these acquired tax benefits would be reported as a reduction to income tax expense in accordance with the recent accounting pronouncement,
Statement of Financial Accounting Standards No. 141(R), or SFAS No. 141(R), Business Combinations, issued by the FASB in December 2007. We would also
recognize an income tax benefit during the period that the realization of the deferred tax assets related to state or foreign tax benefits of $87.2 million becomes more
-
likely
-
than
-
not.
In accordance with Statement of Financial Accounting Standards No. 123(R), or SFAS No. 123(R), Share Based Payment, our deferred tax assets do not
include the excess tax benefit related to stock
-
based compensation that are a component of our federal and state net operating loss and research tax credit
carryforwards in the amount of $588.7 million as of January 25, 2009. Consistent with prior years, the excess tax benefit reflected in our net operating loss and
research tax credit carryforwards will be accounted for as a credit to stockholders
’
equity, if and when realized. In determining if and when excess tax benefits have
been realized, we have elected to do a with
-
and
-
without approach with respect to such excess tax benefits. We have also elected to ignore the indirect tax effects
of stock
-
based compensation deductions for financial and accounting reporting purposes, and specifically to recognize the full effect of the research tax credit in
income from continuing operations.
As of January 25, 2009, we had a federal net operating loss carryforward of $1.16 billion, cumulative state net operating loss carryforwards of $791.6 million,
and a foreign net operating loss carryforward of $25.3 million. The federal net operating loss carryforward will expire beginning in fiscal 2012, the state net
operating loss carryforwards will begin to expire in fiscal 2010 in accordance with the rules of each particular state, and the foreign net operating loss carryforward
may be carried forward indefinitely. As of January 25, 2009, we had federal research tax credit carryforwards of $223.0 million that will begin to expire in fiscal
2010. We have other federal tax credit carryforwards of $1.9 million that will begin to expire in fiscal 2011. The research tax credit carryforwards attributable to
states is in the amount of $212.3 million, of which $204.8 million is attributable to the State of California and may be carried over indefinitely, and $7.5 million is
attributable to various other states and will expire beginning in fiscal 2010 according to the rules of each particular state. We have other state tax credit
carryforwards of $7.0 million that will begin to expire in fiscal 2010. Utilization of federal and state net operating losses and tax credit carryforwards may be subject
to limitations due to ownership changes and other limitations provided by the Internal Revenue Code and similar state provisions. Utilization of the foreign net
operating loss may be limited due to a change in business in connection with an ownership change. If any such limitations apply, the federal, states, or foreign
net operating loss and tax credit carryforwards, as applicable, may expire or be denied before utilization.
January 25,
2009
January 27,
2008
(In thousands)
Deferred tax assets:
Net operating loss carryforwards
$
27,593
$
22,814
Accruals and reserves, not currently deductible for tax purposes
26,015
20,769
Property, equipment and intangible assets
23,935
7,513
Research and other tax credit carryforwards
123,620
147,417
Stock
-
based compensation
55,680
36,413
Gross deferred tax assets
256,843
234,926
Less: valuation allowance
(92,541
)
(82,522
)
Total deferred tax assets
164,302
152,404
Deferred tax liabilities:
Unremitted earnings of foreign subsidiaries
(223,223
)
(228,227
)
Net deferred tax asset (liability)
$
(58,921
)
$
(75,823
)
101