NVIDIA 2008 Annual Report Download - page 73
Download and view the complete annual report
Please find page 73 of the 2008 NVIDIA annual report below. You can navigate through the pages in the report by either clicking on the pages listed below, or by using the keyword search tool below to find specific information within the annual report.-
 1
1 -
2
-
3
-
4
-
5
-
6
-
7
-
8
-
9
-
10
-
11
-
12
-
13
-
14
-
15
-
16
-
17
-
18
-
19
-
20
-
21
-
22
-
23
-
24
-
25
-
26
-
27
-
28
-
29
-
30
-
31
-
32
-
33
-
34
-
35
-
36
-
37
-
38
-
39
-
40
-
41
-
42
-
43
-
44
-
45
-
46
-
47
-
48
-
49
-
50
-
51
-
52
-
53
-
54
-
55
-
56
-
57
-
58
-
59
-
60
-
61
-
62
-
 63
63 -
 64
64 -
 65
65 -
 66
66 -
 67
67 -
 68
68 -
 69
69 -
 70
70 -
 71
71 -
 72
72 -
 73
73 -
 74
74 -
 75
75 -
 76
76 -
 77
77 -
 78
78 -
 79
79 -
 80
80 -
 81
81 -
 82
82 -
 83
83 -
84
-
85
-
86
-
87
-
88
-
89
-
90
-
91
-
92
-
93
-
94
-
95
-
96
-
97
-
98
-
99
-
100
-
101
-
102
-
103
-
104
-
105
-
106
-
107
-
108
-
109
-
110
-
111
-
112
-
113
-
114
-
115
-
116
-
117
-
118
-
119
-
120
-
121
-
122
-
123
-
124
 |
 |

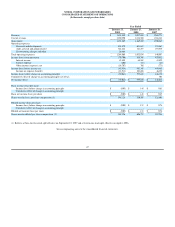
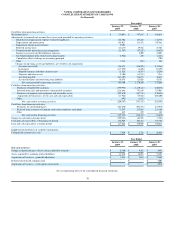
NVIDIA CORPORATION AND SUBSIDIARIES
CONSOLIDATED STATEMENTS OF CASH FLOWS
(In thousands)
See accompanying notes to the consolidated financial statements.
Year ended
January 25,
2009
January 27,
2008
January 28,
2007
Cash flows from operating activities:
Net income (loss)
$
(30,041
)
$
797,645
$
448,834
Adjustments to reconcile net income (loss) to net cash provided by operating activities:
Stock
-
based compensation expense related to employees
162,706
133,365
116,735
Depreciation and amortization
185,023
133,192
107,562
Impairment charge on investments
9,891
-
-
Deferred income taxes
(23,277
)
89,516
41,766
Payments under patent licensing arrangement
(21,797
)
(57,255
)
(14,430
)
In
-
process research and development expenses
-
4,000
14,002
Tax benefit (deficit) from stock
-
based compensation
(2,946
)
220
(8,482
)
Cumulative effect of change in accounting principle
-
-
(704
)
Other
3,134
(436
)
268
Changes in operating assets and liabilities, net of effects of acquisitions:
Accounts receivable
348,873
(146,055
)
(175,261
)
Inventories
(177,295
)
(3,690
)
(91,395
)
Prepaid expenses and other current assets
21,528
(6,293
)
(5,294
)
Deposits and other assets
(2,108
)
(13,914
)
7,314
Accounts payable
(283,207
)
216,875
38,613
Accrued liabilities and other long
-
term liabilities
58,876
123,026
93,153
Net cash provided by operating activities
249,360
1,270,196
572,681
Cash flows from investing activities:
Purchases of marketable securities
(999,953
)
(1,250,248
)
(220,834
)
Proceeds from sales and maturities of marketable securities
1,226,646
753,839
227,067
Purchases of property and equipment and intangible assets
(407,670
)
(187,745
)
(130,826
)
Acquisition of businesses, net of cash and cash equivalents
(27,948
)
(75,542
)
(401,800
)
Other
(442
)
(1,622
)
-
Net cash used in investing activities
(209,367
)
(761,318
)
(526,393
)
Cash flows from financing activities:
Payments for stock repurchases
(423,636
)
(552,512
)
(274,978
)
Proceeds from issuance of common stock under employee stock plans
73,547
225,969
221,160
Other
815
220
188
Net cash used in financing activities
(349,274
)
(326,323
)
(53,630
)
Change in cash and cash equivalents
(309,281
)
182,555
(7,342
)
Cash and cash equivalents at beginning of period
726,969
544,414
551,756
Cash and cash equivalents at end of period
$
417,688
$
726,969
$
544,414
Supplemental disclosures of cash flow information:
Cash paid for income taxes, net
$
7,620
$
2,328
$
26,628
Year Ended
January 25,
2009
January 27,
2008
January 28,
2007
Non
-
cash activities:
Change in unrealized gains (losses) from marketable securities
$
(6,360
)
$
9,462
$
4,492
Assets acquired by assuming related liabilities
$
47,236
$
18,072
$
37,251
Acquisition of business
-
goodwill adjustment
$
3,411
$
2,633
$
17,862
Deferred stock
-
based compensation
$
-
$
-
$
3,604
Acquisition of business
-
stock option conversion
$
-
$
-
$
2,914
70