NVIDIA 2008 Annual Report Download - page 70
Download and view the complete annual report
Please find page 70 of the 2008 NVIDIA annual report below. You can navigate through the pages in the report by either clicking on the pages listed below, or by using the keyword search tool below to find specific information within the annual report.-
 1
1 -
2
-
3
-
4
-
5
-
6
-
7
-
8
-
9
-
10
-
11
-
12
-
13
-
14
-
15
-
16
-
17
-
18
-
19
-
20
-
21
-
22
-
23
-
24
-
25
-
26
-
27
-
28
-
29
-
30
-
31
-
32
-
33
-
34
-
35
-
36
-
37
-
38
-
39
-
40
-
41
-
42
-
43
-
44
-
45
-
46
-
47
-
48
-
49
-
50
-
51
-
52
-
53
-
54
-
55
-
56
-
57
-
58
-
59
-
 60
60 -
 61
61 -
 62
62 -
 63
63 -
 64
64 -
 65
65 -
 66
66 -
 67
67 -
 68
68 -
 69
69 -
 70
70 -
 71
71 -
 72
72 -
 73
73 -
 74
74 -
 75
75 -
 76
76 -
 77
77 -
 78
78 -
 79
79 -
 80
80 -
81
-
82
-
83
-
84
-
85
-
86
-
87
-
88
-
89
-
90
-
91
-
92
-
93
-
94
-
95
-
96
-
97
-
98
-
99
-
100
-
101
-
102
-
103
-
104
-
105
-
106
-
107
-
108
-
109
-
110
-
111
-
112
-
113
-
114
-
115
-
116
-
117
-
118
-
119
-
120
-
121
-
122
-
123
-
124
 |
 |

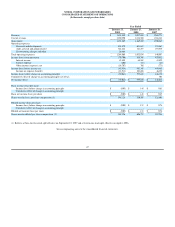
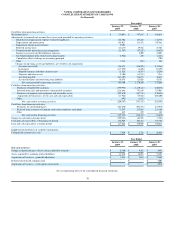
NVIDIA CORPORATION AND SUBSIDIARIES
CONSOLIDATED STATEMENTS OF OPERATIONS
(In thousands, except per share data)
(1)
Reflects a three
-
for
-
two stock split effective on September 10, 2007 and a two
-
for
-
one stock split effective on April 6, 2006.
See accompanying notes to the consolidated financial statements.
Year Ended
January 25,
2009
January 27,
2008
January 28,
2007
Revenue
$
3,424,859
$
4,097,860
$
3,068,771
Cost of revenue
2,250,590
2,228,580
1,768,322
Gross profit
1,174,269
1,869,280
1,300,449
Operating expenses:
Research and development
855,879
691,637
553,467
Sales, general and administrative
362,222
341,297
293,530
Restructuring charges and other
26,868
-
-
Total operating expenses
1,244,969
1,032,934
846,997
Income (loss) from operations
(70,700
)
836,346
453,452
Interest income
42,859
64,289
41,820
Interest expense
(406
)
(54
)
(21
)
Other income (expense), net
(14,707
)
760
(771
)
Income (loss) before income tax
(42,954
)
901,341
494,480
Income tax expense (benefit)
(12,913
)
103,696
46,350
Income (loss) before change in accounting principle
(30,041
)
797,645
448,130
Cumulative effect of change in accounting principle, net of tax
-
-
704
Net income (loss)
$
(30,041
)
$
797,645
$
448,834
Basic income (loss) per share:
Income (loss) before change in accounting principle
$
(0.05
)
$
1.45
$
0.85
Cumulative effect of change in accounting principle
-
-
-
Basic net income (loss) per share
$
(0.05
)
$
1.45
$
0.85
Shares used in basic per share computation (1)
548,126
550,108
528,606
Diluted income (loss) per share:
Income (loss) before change in accounting principle
$
(0.05
)
$
1.31
$
0.76
Cumulative effect of change in accounting principle
-
-
-
Diluted net income (loss) per share
$
(0.05
)
$
1.31
$
0.76
Shares used in diluted per share computation (1)
548,126
606,732
587,256
67