Medtronic 2014 Annual Report Download - page 95
Download and view the complete annual report
Please find page 95 of the 2014 Medtronic annual report below. You can navigate through the pages in the report by either clicking on the pages listed below, or by using the keyword search tool below to find specific information within the annual report.-
 1
1 -
2
-
3
-
4
-
5
-
6
-
7
-
8
-
9
-
10
-
11
-
12
-
13
-
14
-
15
-
16
-
17
-
18
-
19
-
20
-
21
-
22
-
23
-
24
-
25
-
26
-
27
-
28
-
29
-
30
-
31
-
32
-
33
-
34
-
35
-
36
-
37
-
38
-
39
-
40
-
41
-
42
-
43
-
44
-
45
-
46
-
47
-
48
-
49
-
50
-
51
-
52
-
53
-
54
-
55
-
56
-
57
-
58
-
59
-
60
-
61
-
62
-
63
-
64
-
65
-
66
-
67
-
68
-
69
-
70
-
71
-
72
-
73
-
74
-
75
-
76
-
77
-
78
-
79
-
80
-
81
-
82
-
83
-
84
-
 85
85 -
 86
86 -
 87
87 -
 88
88 -
 89
89 -
 90
90 -
 91
91 -
 92
92 -
 93
93 -
 94
94 -
 95
95 -
 96
96 -
 97
97 -
 98
98 -
 99
99 -
 100
100 -
 101
101 -
 102
102 -
 103
103 -
 104
104 -
 105
105 -
106
-
107
-
108
-
109
-
110
-
111
-
112
-
113
-
114
-
115
-
116
-
117
-
118
-
119
-
120
-
121
-
122
-
123
-
124
-
125
-
126
-
127
-
128
-
129
-
130
-
131
-
132
-
133
-
134
-
135
-
136
-
137
-
138
-
139
-
140
-
141
-
142
-
143
-
144
-
145
-
146
-
147
 |
 |

Medtronic, Inc.
Notes to Consolidated Financial Statements (Continued)
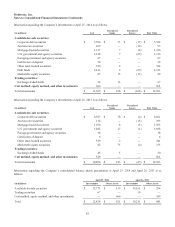
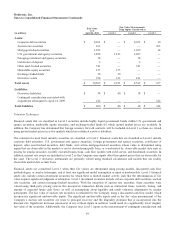
As of April 25, 2014, April 26, 2013, and April 27, 2012, the credit loss portion of other-than-temporary impairments on debt
securities was $4 million, $9 million, and $20 million, respectively. The total reductions for available-for-sale debt securities
sold for the fiscal years ended April 25, 2014 and April 26, 2013 were $5 million and $11 million, respectively. The total other-
than-temporary impairment losses on available-for-sale debt securities for the fiscal years ended April 25, 2014 and April 26,
2013 were not significant. The total other-than-temporary impairment losses on available-for-sale debt securities for the fiscal
year ended April 27, 2012 was $6 million, of which $4 million was recognized in other comprehensive income and $2 million
was recognized in earnings.
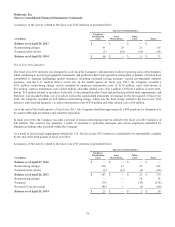
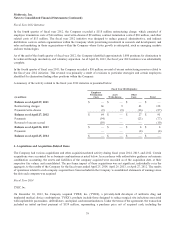
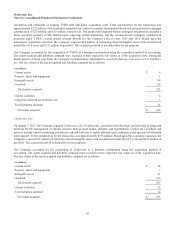
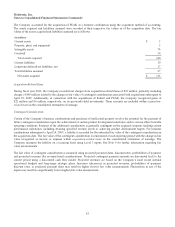
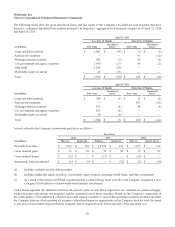
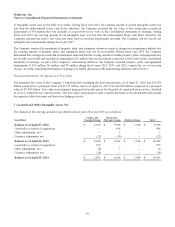
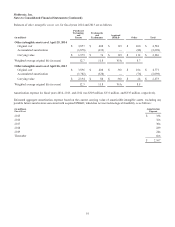
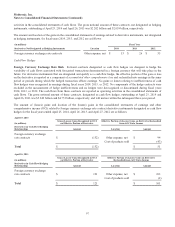
The April 25, 2014 balance of available-for-sale debt securities, excluding debt funds which have no single maturity date, by
contractual maturity is shown in the following table. Within the table, maturities of mortgage-backed securities have been
allocated based upon timing of estimated cash flows, assuming no change in the current interest rate environment. Actual
maturities may differ from contractual maturities because the issuers of the securities may have the right to prepay obligations
without prepayment penalties.
(in millions) April 25, 2014
Due in one year or less $ 1,412
Due after one year through five years 6,368
Due after five years through 10 years 2,859
Due after 10 years 115
Total debt securities $ 10,754
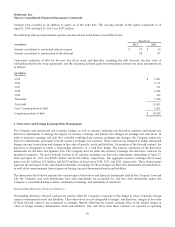
As of April 25, 2014 and April 26, 2013, the aggregate carrying amount of equity and other securities without a quoted market
price and accounted for using the cost or equity method was $666 million and $549 million, respectively. The total carrying
value of these investments is reviewed quarterly for changes in circumstance or the occurrence of events that suggest the
Company’s investment may not be recoverable. The value of cost or equity method investments is not adjusted if there are no
identified events or changes in circumstances that may have a material adverse effect on the fair value of the investment.
Gains and losses realized on trading securities and available-for-sale debt securities are recorded in interest expense, net in the
consolidated statements of earnings. Gains and losses realized on marketable equity securities, cost method, equity method, and
other investments are recorded in other expense, net in the consolidated statements of earnings. In addition, unrealized gains and
losses on available-for-sale debt securities are recorded in other comprehensive income (loss) in the consolidated statements of
comprehensive income and unrealized gains and losses on trading securities are recorded in interest expense, net in the
consolidated statements of earnings. Gains and losses from the sale of investments are calculated based on the specific
identification method.
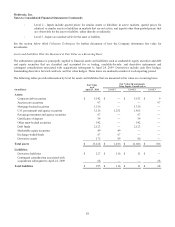
6. Fair Value Measurements
The Company follows the authoritative guidance on fair value measurements and disclosures with respect to assets and
liabilities that are measured at fair value on both a recurring and nonrecurring basis. Under this guidance, fair value is defined as
the exit price, or the amount that would be received to sell an asset or paid to transfer a liability in an orderly transaction
between market participants as of the measurement date. The authoritative guidance also establishes a hierarchy for inputs used
in measuring fair value that maximizes the use of observable inputs and minimizes the use of unobservable inputs by requiring
that the most observable inputs be used when available. Observable inputs are inputs market participants would use in valuing
the asset or liability, based on market data obtained from sources independent of the Company. Unobservable inputs are inputs
that reflect the Company’s assumptions about the factors market participants would use in valuing the asset or liability
developed based upon the best information available in the circumstances. The categorization of financial assets and financial
liabilities within the valuation hierarchy is based upon the lowest level of input that is significant to the fair value measurement.
The hierarchy is broken down into three levels defined as follows:
•Level 1 - Inputs are quoted prices in active markets for identical assets or liabilities.
87