Medtronic 2014 Annual Report Download - page 21
Download and view the complete annual report
Please find page 21 of the 2014 Medtronic annual report below. You can navigate through the pages in the report by either clicking on the pages listed below, or by using the keyword search tool below to find specific information within the annual report.-
 1
1 -
2
-
3
-
4
-
5
-
6
-
7
-
8
-
9
-
10
-
 11
11 -
 12
12 -
 13
13 -
 14
14 -
 15
15 -
 16
16 -
 17
17 -
 18
18 -
 19
19 -
 20
20 -
 21
21 -
 22
22 -
 23
23 -
 24
24 -
 25
25 -
 26
26 -
 27
27 -
 28
28 -
 29
29 -
 30
30 -
 31
31 -
32
-
33
-
34
-
35
-
36
-
37
-
38
-
39
-
40
-
41
-
42
-
43
-
44
-
45
-
46
-
47
-
48
-
49
-
50
-
51
-
52
-
53
-
54
-
55
-
56
-
57
-
58
-
59
-
60
-
61
-
62
-
63
-
64
-
65
-
66
-
67
-
68
-
69
-
70
-
71
-
72
-
73
-
74
-
75
-
76
-
77
-
78
-
79
-
80
-
81
-
82
-
83
-
84
-
85
-
86
-
87
-
88
-
89
-
90
-
91
-
92
-
93
-
94
-
95
-
96
-
97
-
98
-
99
-
100
-
101
-
102
-
103
-
104
-
105
-
106
-
107
-
108
-
109
-
110
-
111
-
112
-
113
-
114
-
115
-
116
-
117
-
118
-
119
-
120
-
121
-
122
-
123
-
124
-
125
-
126
-
127
-
128
-
129
-
130
-
131
-
132
-
133
-
134
-
135
-
136
-
137
-
138
-
139
-
140
-
141
-
142
-
143
-
144
-
145
-
146
-
147
 |
 |

achieve this objective, we organize our marketing and sales teams around physician specialties. This focus enables us to develop
highly knowledgeable and dedicated sales representatives who are able to foster strong relationships with physicians and other
customers and enhance our ability to cross-sell complementary products. We believe that we maintain excellent working
relationships with physicians and others in the medical industry that enable us to gain a detailed understanding of therapeutic
and diagnostic developments, trends, and emerging opportunities and respond quickly to the changing needs of physicians and
patients. We attempt to enhance our presence in the medical community through active participation in medical meetings and by
conducting comprehensive training and educational activities. We believe that these activities contribute to physician expertise.
In keeping with the increased emphasis on cost-effectiveness in health care delivery, the current trend among hospitals and other
customers of medical device manufacturers is to consolidate into larger purchasing groups to enhance purchasing power. As a
result, transactions with customers have become increasingly significant and more complex. This enhanced purchasing power
may also lead to pressure on pricing and increased use of preferred vendors. Our customer base continues to evolve to reflect
such economic changes across the geographic markets we serve. We are not dependent on any single customer for more than
10 percent of our total net sales.
Competition and Industry
We compete in both the therapeutic and diagnostic medical markets in more than 140 countries throughout the world. These
markets are characterized by rapid change resulting from technological advances and scientific discoveries. The product lines in
which we compete face a mixture of competitors ranging from large manufacturers with multiple business lines to small
manufacturers offering a limited selection of products. In addition, we face competition from providers of alternative medical
therapies such as pharmaceutical companies.
Major shifts in industry market share have occurred in connection with product problems, physician advisories, safety alerts,
and publications about our products, reflecting the importance of product quality, product efficacy, and quality systems in the
medical device industry. In addition, in the current environment of managed care, economically motivated customers,
consolidation among health care providers, increased competition, and declining reimbursement rates, we have been
increasingly required to compete on the basis of price. In order to continue to compete effectively, we must continue to create or
acquire advanced technology, incorporate this technology into proprietary products, obtain regulatory approvals in a timely
manner, maintain high-quality manufacturing processes, and successfully market these products.
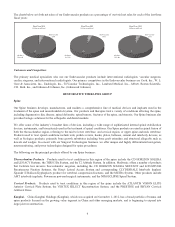
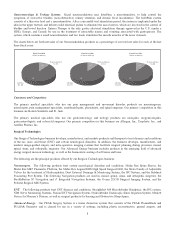
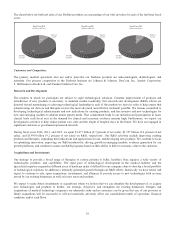
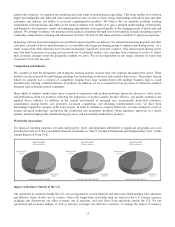
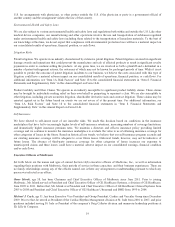
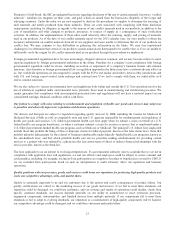
Worldwide Operations
For financial reporting purposes, net sales and property, plant, and equipment attributable to significant geographic areas are
presented in Note 20 to the consolidated financial statements in “Item 8. Financial Statements and Supplementary Data” in this
Annual Report on Form 10-K.
Fiscal Year 2012
(dollars in millions)
United States
$8,828
Outside the U.S.
$7,356
Fiscal Year 2013
(dollars in millions)
Outside the U.S.
$7,531
United States
$9,059
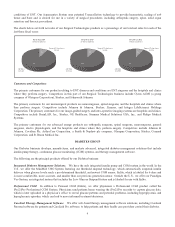
Fiscal Year 2014
(dollars in millions)
Outside the U.S.
$7,796
United States
$9,209
Consolidated Net Sales $16,184Consolidated Net Sales $16,590Consolidated Net Sales $17,005
54%
46%
55%
45%
55%
45%
Impact of Business Outside of the U.S.
Our operations in countries outside the U.S. are accompanied by certain financial and other risks. Relationships with customers
and effective terms of sale vary by country, often with longer-term receivables than are typical in the U.S. Foreign currency
exchange rate fluctuations can affect revenues, net of expenses, and cash flows from operations outside the U.S. We use
operational and economic hedges, as well as currency exchange rate derivative contracts, to manage the impact of currency
13