Medtronic 2014 Annual Report Download - page 42
Download and view the complete annual report
Please find page 42 of the 2014 Medtronic annual report below. You can navigate through the pages in the report by either clicking on the pages listed below, or by using the keyword search tool below to find specific information within the annual report.-
 1
1 -
2
-
3
-
4
-
5
-
6
-
7
-
8
-
9
-
10
-
11
-
12
-
13
-
14
-
15
-
16
-
17
-
18
-
19
-
20
-
21
-
22
-
23
-
24
-
25
-
26
-
27
-
28
-
29
-
30
-
31
-
 32
32 -
 33
33 -
 34
34 -
 35
35 -
 36
36 -
 37
37 -
 38
38 -
 39
39 -
 40
40 -
 41
41 -
 42
42 -
 43
43 -
 44
44 -
 45
45 -
 46
46 -
 47
47 -
 48
48 -
 49
49 -
 50
50 -
 51
51 -
 52
52 -
53
-
54
-
55
-
56
-
57
-
58
-
59
-
60
-
61
-
62
-
63
-
64
-
65
-
66
-
67
-
68
-
69
-
70
-
71
-
72
-
73
-
74
-
75
-
76
-
77
-
78
-
79
-
80
-
81
-
82
-
83
-
84
-
85
-
86
-
87
-
88
-
89
-
90
-
91
-
92
-
93
-
94
-
95
-
96
-
97
-
98
-
99
-
100
-
101
-
102
-
103
-
104
-
105
-
106
-
107
-
108
-
109
-
110
-
111
-
112
-
113
-
114
-
115
-
116
-
117
-
118
-
119
-
120
-
121
-
122
-
123
-
124
-
125
-
126
-
127
-
128
-
129
-
130
-
131
-
132
-
133
-
134
-
135
-
136
-
137
-
138
-
139
-
140
-
141
-
142
-
143
-
144
-
145
-
146
-
147
 |
 |

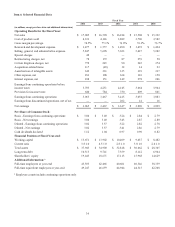
Item 6. Selected Financial Data
Fiscal Year
2014 2013 2012 2011 2010
(in millions, except per share data and additional information)
Operating Results for the Fiscal Year:
Net sales $ 17,005 $ 16,590 $ 16,184 $ 15,508 $ 15,392
Cost of products sold 4,333 4,126 3,889 3,700 3,582
Gross margin percentage 74.5% 75.1% 76.0% 76.1% 76.7%
Research and development expense $ 1,477 $ 1,557 $ 1,490 $ 1,472 $ 1,424
Selling, general, and administrative expense 5,847 5,698 5,623 5,427 5,282
Special charges 40————
Restructuring charges, net 78 172 87 259 50
Certain litigation charges, net 770 245 90 245 374
Acquisition-related items 117 (49) 12 14 23
Amortization of intangible assets 349 331 335 339 317
Other expense, net 181 108 364 110 150
Interest expense, net 108 151 149 278 246
Earnings from continuing operations before
income taxes 3,705 4,251 4,145 3,664 3,944
Provision for income taxes 640 784 730 609 861
Earnings from continuing operations 3,065 3,467 3,415 3,055 3,083
Earnings from discontinued operations, net of tax — — 202 41 16
Net earnings $ 3,065 $ 3,467 $ 3,617 $ 3,096 $ 3,099
Per Share of Common Stock:
Basic - Earnings from continuing operations $ 3.06 $ 3.40 $ 3.24 $ 2.84 $ 2.79
Basic - Net earnings 3.06 3.40 3.43 2.87 2.80
Diluted - Earnings from continuing operations 3.02 3.37 3.22 2.82 2.78
Diluted - Net earnings 3.02 3.37 3.41 2.86 2.79
Cash dividends declared 1.12 1.04 0.97 0.90 0.82
Financial Position at Fiscal Year-end:
Working capital $ 15,651 $ 13,902 $ 10,409 $ 9,437 $ 8,482
Current ratio 3.8:1.0 4.5:1.0 2.8:1.0 3.0:1.0 2.6:1.0
Total assets $ 37,943 $ 34,900 $ 32,818 $ 30,662 $ 28,305
Long-term debt 10,315 9,741 7,359 8,112 6,944
Shareholders’ equity 19,443 18,671 17,113 15,968 14,629
Additional Information:*
Full-time employees at year-end 43,305 42,466 40,601 40,346 38,339
Full-time equivalent employees at year-end 49,247 46,659 44,944 44,315 42,208
* Employee counts include continuing operations only.
34