Logitech 2003 Annual Report Download - page 80
Download and view the complete annual report
Please find page 80 of the 2003 Logitech annual report below. You can navigate through the pages in the report by either clicking on the pages listed below, or by using the keyword search tool below to find specific information within the annual report.-
 1
1 -
2
-
3
-
4
-
5
-
6
-
7
-
8
-
9
-
10
-
11
-
12
-
13
-
14
-
15
-
16
-
17
-
18
-
19
-
20
-
21
-
22
-
23
-
24
-
25
-
26
-
27
-
28
-
29
-
30
-
31
-
32
-
33
-
34
-
35
-
36
-
37
-
38
-
39
-
40
-
41
-
42
-
43
-
44
-
45
-
46
-
47
-
48
-
49
-
50
-
51
-
52
-
53
-
54
-
55
-
56
-
57
-
58
-
59
-
60
-
61
-
62
-
63
-
64
-
65
-
66
-
67
-
68
-
69
-
 70
70 -
 71
71 -
 72
72 -
 73
73 -
 74
74 -
 75
75 -
 76
76 -
 77
77 -
 78
78 -
 79
79 -
 80
80 -
 81
81 -
 82
82 -
 83
83 -
 84
84 -
 85
85 -
 86
86 -
 87
87 -
 88
88 -
 89
89 -
 90
90 -
91
-
92
-
93
-
94
-
95
-
96
-
97
-
98
-
99
-
100
-
101
-
102
-
103
-
104
-
105
-
106
-
107
-
108
-
109
-
110
-
111
-
112
-
113
-
114
-
115
-
116
-
117
-
118
-
119
-
120
-
121
-
122
-
123
-
124
-
125
-
126
-
127
-
128
-
129
-
130
-
131
-
132
-
133
-
134
-
135
-
136
-
137
-
138
-
139
-
140
-
141
-
142
-
143
-
144
-
145
-
146
-
147
-
148
-
149
-
150
-
151
-
152
-
153
-
154
-
155
-
156
-
157
-
158
-
159
-
160
-
161
-
162
-
163
-
164
-
165
-
166
-
167
-
168
-
169
-
170
-
171
-
172
-
173
-
174
-
175
-
176
-
177
-
178
-
179
-
180
-
181
-
182
-
183
-
184
-
185
-
186
-
187
-
188
-
189
-
190
-
191
-
192
-
193
-
194
 |
 |

F-23
LOGITECH INTERNATIONAL S.A.
NOTES TO CONSOLIDATED FINANCIAL STATEMENTS
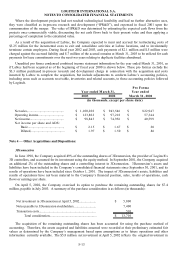
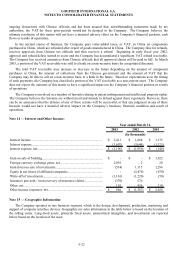
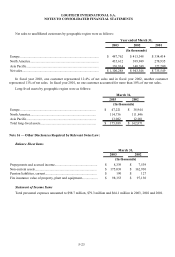
Net sales to unaffiliated customers by geographic region were as follows:
2003 2002 2001
Europe............................................................................................... 487,762$ 413,348$ 334,414$
North America.................................................................................. 435,612 389,949 278,935
Asia Pacific....................................................................................... 176,914 140,249 122,200
Net sales............................................................................................ 1,100,288$ 943,546$ 735,549$
Year ended March 31,
(In thousands)
In fiscal year 2003, one customer represented 12.4% of net sales and in fiscal year 2002, another customer
represented 11% of net sales. In fiscal year 2001, no one customer accounted for more than 10% of our net sales.
Long-lived assets by geographic region were as follows:
2003 2002
Europe........................................................................................... 47,221$ 38,944$
North America............................................................................... 114,736 111,846
Asia Pacific.................................................................................... 13,082 12,081
Total long-lived assets................................................................... 175,039$ 162,871$
March 31,
(In thousands)
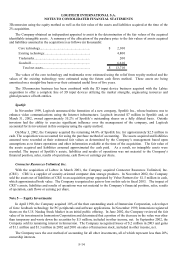
Note 16 — Other Disclosures Required by Relevant Swiss Law:
Balance Sheet Items
2003 2002
Prepayments and accrued income................................................... 8,339$ 7,539$
Non-current assets.......................................................................... 175,038$ 162,930$
Pension liabilities, current.............................................................. 190$ 127$
Fire insurance value of property, plant and equipment................... 98,153$ 97,130$
March 31,
(In thousands)
Statement of Income Items
Total personnel expenses amounted to $98.7 million, $79.3 million and $64.1 million in 2003, 2002 and 2001.