Logitech 2003 Annual Report Download - page 18
Download and view the complete annual report
Please find page 18 of the 2003 Logitech annual report below. You can navigate through the pages in the report by either clicking on the pages listed below, or by using the keyword search tool below to find specific information within the annual report.
5
ITEM 3. KEY INFORMATION
A. Selected Financial Data
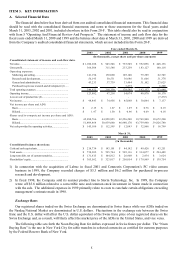
The financial data below has been derived from our audited consolidated financial statements. This financial data
should be read with the consolidated financial statements and notes to those statements for the fiscal years ended
March 31, 2003, 2002 and 2001, included elsewhere in this Form 20-F. This table should also be read in conjunction
with Item 5 "Operating And Financial Review And Prospects.” The statement of income and cash flow data for the
fiscal years ended March 31, 2000 and 1999 and the balance sheet data at March 31, 2001, 2000 and 1999 are derived
from the Company’s audited consolidated financial statements, which are not included in this Form 20-F.
2003 2002 2001 2000 1999
Consolidated statement of income and cash flow data:
Net sales............................................................................ 1,100,288$ 943,546$ 735,549$ 592,096$ 448,136$
Gross profit....................................................................... 364,504 315,548 233,259 183,127 140,118
Operating expenses:
Marketing and selling.................................................... 141,194 130,060 105,140 79,389 62,745
Research and development............................................ 56,195 50,531 36,686 31,666 31,378
General and administrative............................................ 43,233 37,739 33,484 31,102 23,625
Purchased in-process research and development (1)..... - - 3,275 - 6,200
Total operating expenses................................................... 240,622 218,330 178,585 142,157 123,948
Operating income.............................................................. 123,882 97,218 54,674 40,970 16,170
Loss on sale of product line (2)......................................... - - - - (7,272)
Net income........................................................................ 98,843$ 74,956$ 45,068$ 30,044$ 7,137$
Net income per share and ADS:
Basic.............................................................................. 2.15$ 1.67$ 1.07$ 0.76$ 0.19$
Diluted........................................................................... 1.97$ 1.50$ 0.96$ 0.69$ 0.18$
Shares used to compute net income per share and ADS:
Basic.............................................................................. 45,988,766 44,928,853 42,226,240 39,769,900 38,672,200
Diluted........................................................................... 51,409,464 50,939,060 46,940,170 43,759,940 39,826,740
Net cash provided by operating activities.......................... 145,108$ 112,595$ 12,043$ 32,866$ 16,799$
2003 2002 2001 2000 1999
Consolidated balance sheet data:
Cash and cash equivalents................................................. 218,734$ 143,101$ 44,142$ 49,426$ 43,251$
Total assets........................................................................ 738,302$ 595,744$ 505,116$ 334,077$ 294,489$
Long-term debt, net of current maturities.......................... 131,615$ 104,812$ 26,908$ 2,934$ 3,624$
Shareholders' equity.......................................................... 365,562$ 323,017$ 256,054$ 179,969$ 139,754$
Year ended March 31,
March 31,
(In thousands, except share and per share amounts)
(In thousands)
1) In connection with the acquisition of Labtec in fiscal 2001 and Connectix Corporation’s PC video camera
business in 1999, the Company recorded charges of $3.3 million and $6.2 million for purchased in-process
research and development.
2) In fiscal 1998, the Company sold its scanner product line to Storm Technology, Inc. In 1999, the Company
wrote off $5.8 million related to a convertible note and common stock investment in Storm made in connection
with the sale. The additional expenses in 1999 primarily relate to costs to conclude certain obligations exceeding
management’s estimate made in 1998.
Exchange Rates
Our registered shares traded on the Swiss Exchange are denominated in Swiss francs while our ADSs traded on
the Nasdaq National Market are denominated in U.S. dollars. Fluctuations in the exchange rate between the Swiss
franc and the U.S. dollar will affect the U.S. dollar equivalent of the Swiss franc price of our registered shares on the
Swiss Exchange and, as a result, will likely affect the market price of the ADSs in the United States, and vice versa.
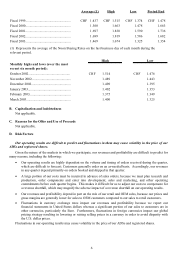
The following table sets forth the Noon Buying Rate for dollars expressed in Swiss francs per dollar. The “Noon
Buying Rate” is the rate in New York City for cable transfers in selected currencies as certified for customs purposes
by the Federal Reserve Bank of New York.


