Logitech 2003 Annual Report Download - page 160
Download and view the complete annual report
Please find page 160 of the 2003 Logitech annual report below. You can navigate through the pages in the report by either clicking on the pages listed below, or by using the keyword search tool below to find specific information within the annual report.-
 1
1 -
2
-
3
-
4
-
5
-
6
-
7
-
8
-
9
-
10
-
11
-
12
-
13
-
14
-
15
-
16
-
17
-
18
-
19
-
20
-
21
-
22
-
23
-
24
-
25
-
26
-
27
-
28
-
29
-
30
-
31
-
32
-
33
-
34
-
35
-
36
-
37
-
38
-
39
-
40
-
41
-
42
-
43
-
44
-
45
-
46
-
47
-
48
-
49
-
50
-
51
-
52
-
53
-
54
-
55
-
56
-
57
-
58
-
59
-
60
-
61
-
62
-
63
-
64
-
65
-
66
-
67
-
68
-
69
-
70
-
71
-
72
-
73
-
74
-
75
-
76
-
77
-
78
-
79
-
80
-
81
-
82
-
83
-
84
-
85
-
86
-
87
-
88
-
89
-
90
-
91
-
92
-
93
-
94
-
95
-
96
-
97
-
98
-
99
-
100
-
101
-
102
-
103
-
104
-
105
-
106
-
107
-
108
-
109
-
110
-
111
-
112
-
113
-
114
-
115
-
116
-
117
-
118
-
119
-
120
-
121
-
122
-
123
-
124
-
125
-
126
-
127
-
128
-
129
-
130
-
131
-
132
-
133
-
134
-
135
-
136
-
137
-
138
-
139
-
140
-
141
-
142
-
143
-
144
-
145
-
146
-
147
-
148
-
149
-
 150
150 -
 151
151 -
 152
152 -
 153
153 -
 154
154 -
 155
155 -
 156
156 -
 157
157 -
 158
158 -
 159
159 -
 160
160 -
 161
161 -
 162
162 -
 163
163 -
 164
164 -
 165
165 -
 166
166 -
 167
167 -
 168
168 -
 169
169 -
 170
170 -
171
-
172
-
173
-
174
-
175
-
176
-
177
-
178
-
179
-
180
-
181
-
182
-
183
-
184
-
185
-
186
-
187
-
188
-
189
-
190
-
191
-
192
-
193
-
194
 |
 |

F-11
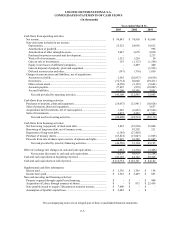
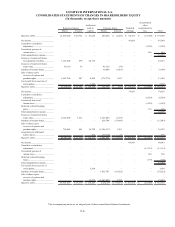
LOGITECH INTERNATIONAL S.A.
NOTES TO CONSOLIDATED FINANCIAL STATEMENTS
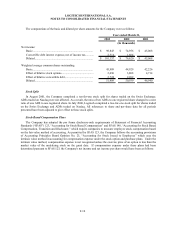
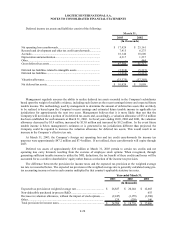
2003 2002 2001
Net income:
As reported......................................................................................... 98,843$ 74,956$ 45,068$
Add back: Stock-based employee compensation expense
included in reported net income....................................................... 92 196 437
Deduct: total stock-based compensation expense determined
under the fair value based method, net of related tax....................... (21,300) (19,380) (13,715)
Pro forma net income........................................................................
.
77,635$ 55,772$ 31,790$
Basic earnings per share and ADS:
As reported......................................................................................... 2.15$ 1.67$ 1.07$
Pro forma basic net income per share and ADS................................. 1.69$ 1.24$ 0.75$
Diluted earnings per share and ADS:
As reported......................................................................................... 1.97$ 1.50$ 0.96$
Pro forma diluted net income per share and ADS.............................. 1.56$ 1.13$ 0.68$
Year ended March 31,
(in thousands, except per share data)
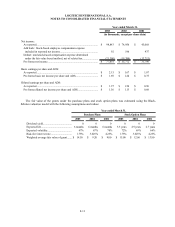
The fair value of the grants under the purchase plans and stock option plans was estimated using the Black-
Scholes valuation model with the following assumptions and values:
2003 2002 2001 2003 2002 2001
Dividend yield.......................................... 0 0 0 0 0 0
Expected life............................................ 6 months 6 months 6 months 3.3 years 2.9 years 2.7 years
Expected volatility................................... 67% 67% 70% 72% 69% 66%
Risk-free interest rate............................... 1.75% 3.625% 4.25% 1.75% 3.625% 4.25%
Weighted average fair value of grant....... 14.50$ 9.20$ 9.00$ 15.00$ 12.06$ 13.80$
Year ended March 31,
Purchase Plans Stock Option Plans