JVC 2004 Annual Report Download - page 53
Download and view the complete annual report
Please find page 53 of the 2004 JVC annual report below. You can navigate through the pages in the report by either clicking on the pages listed below, or by using the keyword search tool below to find specific information within the annual report.-
 1
1 -
2
-
3
-
4
-
5
-
6
-
7
-
8
-
9
-
10
-
11
-
12
-
13
-
14
-
15
-
16
-
17
-
18
-
19
-
20
-
21
-
22
-
23
-
24
-
25
-
26
-
27
-
28
-
29
-
30
-
31
-
32
-
33
-
34
-
35
-
36
-
37
-
38
-
39
-
40
-
41
-
42
-
 43
43 -
 44
44 -
 45
45 -
 46
46 -
 47
47 -
 48
48 -
 49
49 -
 50
50 -
 51
51 -
 52
52 -
 53
53 -
 54
54 -
 55
55 -
 56
56 -
 57
57 -
 58
58 -
 59
59 -
 60
60 -
 61
61
 |
 |

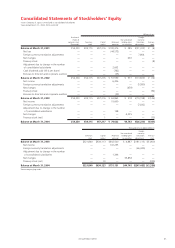
Annual Report 2004 51.
Thousands of U.S. dollars
Elimination
and Consolidated
Japan Americas Europe Asia Total unallocation total
2004:
Sales
External sales $3,325,330 $2,064,877 $2,293,028 $1,014,671 $ 8,697,906 $ — $8,697,906
Intersegment sales 2,558,434 9,104 15,453 1,822,726 4,405,717 (4,405,717) —
Total sales 5,883,764 2,073,981 2,308,481 2,837,397 13,103,623 (4,405,717) 8,697,906
Operating expenses 5,741,434 2,097,575 2,244,547 2,781,227 12,864,783 (4,404,151) 8,460,632
Operating income $ 142,330 $ (23,594) $ 63,934 $ 56,170 $ 238,840 $ (1,566) $ 237,274
Identifiable assets $3,003,651 $ 667,915 $ 843,028 $ 945,746 $ 5,460,340 $ (676,217) $4,784,123
As explained in Note 3 “CHANGE IN ACCOUNTING METHOD”,
effective April 1, 2002, the Company changed the method of
accounting for royalty income. As a result, external sales, operating
expenses and operating income of Japan increased by ¥7,356
million, ¥4,066 million, ¥3,290 million respectively.
3) Overseas sales information by geographic area is as follows:
Millions of yen
Americas Europe Asia Other areas Total
2004:
Overseas sales ¥225,849 ¥247,493 ¥140,424 ¥6,196 ¥619,962
Consolidated sales ¥921,978
Ratio of overseas sales to consolidated sales 24.5% 26.8% 15.2% 0.7% 67.2%
2003:
Overseas sales ¥268,674 ¥229,222 ¥133,024 ¥7,172 ¥638,092
Consolidated sales ¥967,640
Ratio of overseas sales to consolidated sales 27.8% 23.7% 13.7% 0.7% 65.9%
2002:
Overseas sales ¥299,512 ¥197,621 ¥123,883 ¥5,193 ¥626,209
Consolidated sales ¥954,172
Ratio of overseas sales to consolidated sales 31.4% 20.7% 13.0% 0.5% 65.6%
Thousands of U.S. dollars
Americas Europe Asia Other areas Total
2004:
Overseas sales $2,130,651 $2,334,840 $1,324,755 $58,452 $5,848,698
Consolidated sales $8,697,906
Ratio of overseas sales to consolidated sales 24.5% 26.8% 15.2% 0.7% 67.2%
As explained in Note 3 “CHANGE IN ACCOUNTING METHOD”,
effective April 1, 2002, the Company changed the method of
accounting for royalty income. As a result, total overseas sales
increased by ¥3,365 million, and overseas sales of Americas,
Europe and Asia increased by ¥2,741 million, ¥69 million, and
¥555 million respectively.