JVC 2004 Annual Report Download - page 44
Download and view the complete annual report
Please find page 44 of the 2004 JVC annual report below. You can navigate through the pages in the report by either clicking on the pages listed below, or by using the keyword search tool below to find specific information within the annual report.-
 1
1 -
2
-
3
-
4
-
5
-
6
-
7
-
8
-
9
-
10
-
11
-
12
-
13
-
14
-
15
-
16
-
17
-
18
-
19
-
20
-
21
-
22
-
23
-
24
-
25
-
26
-
27
-
28
-
29
-
30
-
31
-
32
-
33
-
 34
34 -
 35
35 -
 36
36 -
 37
37 -
 38
38 -
 39
39 -
 40
40 -
 41
41 -
 42
42 -
 43
43 -
 44
44 -
 45
45 -
 46
46 -
 47
47 -
 48
48 -
 49
49 -
 50
50 -
 51
51 -
 52
52 -
 53
53 -
 54
54 -
55
-
56
-
57
-
58
-
59
-
60
-
61
 |
 |

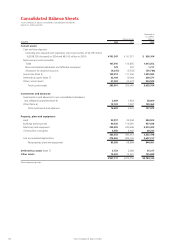
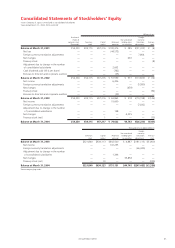
Victor Company of Japan, Limited42.
Consolidated Statements of Cash Flows
Victor Company of Japan, Limited and its consolidated subsidiaries
Years ended March 31, 2004, 2003 and 2002
Thousands of
U.S. dollars
Millions of yen (Note 1)
2004 2003 2002 2004
Cash flows from operating activities:
Income (Loss) before income taxes and minority interests ¥ 14,106 ¥ 10,064 ¥(38,446) $ 133,075
Depreciation 21,461 24,062 26,826 202,462
Interest and dividend income (711) (949) (1,108) (6,708)
Interest expense 2,840 3,403 4,447 26,792
Unrealized loss from changes in fair market values of
trading securities ——280 –
Increase (Decrease) in accrued restructuring charges 2,263 (12,550) 13,423 21,349
Gain on sales of investment securities (280) (318) (1,099) (2,642)
Decrease in notes and accounts receivable 10,157 15,211 12,055 95,821
Decrease (Increase) in inventories (23,463) 18,062 35,370 (221,349)
Increase (Decrease) in notes and accounts payable 13,917 (6,983) (18,224) 131,292
Other 6,971 (3,287) 4,920 65,766
Sub-total 47,261 46,715 38,444 445,858
Interest and dividends received 721 962 1,178 6,802
Interest paid (2,913) (3,447) (4,539) (27,481)
Income taxes paid (4,342) (8,452) (7,001) (40,962)
Net cash provided by operating activities 40,727 35,778 28,082 384,217
Cash flows from investing activities:
Purchases of time deposits (9,100) (8,000) — (85,849)
Withdrawal of time deposits 13,100 5,000 3,000 123,585
Purchases of property, plant and equipment (21,124) (18,517) (22,853) (199,283)
Proceeds from sales of property, plant and equipment 5,132 6,440 2,710 48,415
Purchases of marketable securities ——(13,006) —
Proceeds from sales of marketable securities —2,804 18,166 —
Purchases of investment securities (1,465) (53) (719) (13,821)
Proceeds from sales of investment securities 886 3,468 5,285 8,358
Additional investment in newly consolidated entity —(421) — —
Other (3,266) (3,208) 1,799 (30,811)
Net cash used in investing activities (15,837) (12,487) (5,618) (149,406)
Cash flows from financing activities:
Proceeds from long-term loans —30,005 1,230 —
Repayments of long-term loans (8,046) (1,715) (4,254) (75,906)
Redemption of bonds (6,519) (24,970) (10,101) (61,500)
Increase (Decrease) in short-term bank loans, net 5,367 (9,719) (15,208) 50,632
Decrease in commercial paper, net —(734) (5,527) —
Cash dividends paid (144) (168) (970) (1,358)
Other (34) (36) 121 (321)
Net cash used in financing activities (9,376) (7,337) (34,709) (88,453)
Effect of exchange rate changes on cash and cash equivalents (2,571) (1,813) 2,136 (24,254)
Net increase (decrease) in cash and cash equivalents 12,943 14,141 (10,109) 122,104
Cash and cash equivalents at beginning of the year 83,412 69,271 79,251 786,906
Effect of changes in the number of consolidated subsidiaries
and companies accounted for by the equity method 887 —129 8,368
Cash and cash equivalents at end of the year ¥ 97,242 ¥ 83,412 ¥ 69,271 $ 917,378
See accompanying notes.