JVC 2004 Annual Report Download - page 34
Download and view the complete annual report
Please find page 34 of the 2004 JVC annual report below. You can navigate through the pages in the report by either clicking on the pages listed below, or by using the keyword search tool below to find specific information within the annual report.-
 1
1 -
2
-
3
-
4
-
5
-
6
-
7
-
8
-
9
-
10
-
11
-
12
-
13
-
14
-
15
-
16
-
17
-
18
-
19
-
20
-
21
-
22
-
23
-
 24
24 -
 25
25 -
 26
26 -
 27
27 -
 28
28 -
 29
29 -
 30
30 -
 31
31 -
 32
32 -
 33
33 -
 34
34 -
 35
35 -
 36
36 -
 37
37 -
 38
38 -
 39
39 -
 40
40 -
 41
41 -
 42
42 -
 43
43 -
 44
44 -
45
-
46
-
47
-
48
-
49
-
50
-
51
-
52
-
53
-
54
-
55
-
56
-
57
-
58
-
59
-
60
-
61
 |
 |

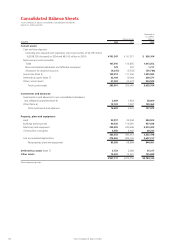
Victor Company of Japan, Limited32.
Five-Year Summary
Victor Company of Japan, Limited and its consolidated subsidiaries
Years ended March 31
Thousands of
U.S. dollars
Millions of yen (Note 1)
2004 2003 2002 2001 2000 2004
For the year:
Net sales ¥921,978 ¥967,640 ¥954,172 ¥934,350 ¥870,235 $8,697,906
Overseas 619,962 638,092 626,209 567,977 545,316 5,848,698
Domestic 302,016 329,548 327,963 366,373 324,919 2,849,208
Cost of sales 629,125 668,821 684,458 641,209 600,506 5,935,141
Selling, general and administrative expenses 267,702 276,520 281,808 287,449 277,748 2,525,491
Operating income (loss) 25,151 22,299 (12,094) 5,692 (8,019) 237,274
Income (Loss) before income taxes and
minority interests 14,106 10,064 (38,446) 9,444 6,088 133,075
Income taxes (1,926) 3,568 5,985 7,238 11,295 (18,170)
Net income (loss) 15,609 6,336 (44,572) 2,498 (5,341) 147,255
Depreciation and amortization 22,735 25,250 28,000 28,085 28,590 214,481
Capital expenditures 25,900 21,036 21,175 31,127 24,336 244,340
R&D expenditures 40,574 40,973 40,981 44,094 43,351 382,774
Thousands of
U.S. dollars
Millions of yen (Note 1)
At year-end:
Working capital ¥147,225 ¥149,172 ¥118,948 ¥150,067 ¥127,709 $1,388,915
Stockholders’ equity 159,326 146,410 146,246 180,515 199,164 1,503,076
Total assets 507,117 479,750 513,365 586,628 540,359 4,784,123
U.S. dollars
Yen (Note 1)
Per share:
Net income (loss) (Note 2) ¥ 61.1 ¥ 24.9 ¥ (175.3) ¥ 9.8 ¥ (21.0) $ 0.58
Diluted net income (Note 2) 57.9 23.5 — — — 0.55
Cash dividends (Note 3) 5.0 ——3.0— 0.05
Notes: 1. U.S. dollar amounts have been translated, for convenience only, at the exchange rate of ¥106 to U.S.$1, the approximate rate prevailing on March 31, 2004.
2. Net income (loss) per share of common stock for the years ended March 31, 2002, 2001 and 2000 have not been recalculated using the new accounting
standard, which is effective April 1, 2002.
3. Cash dividends represent amounts applicable to the respective years.