JVC 2004 Annual Report Download - page 37
Download and view the complete annual report
Please find page 37 of the 2004 JVC annual report below. You can navigate through the pages in the report by either clicking on the pages listed below, or by using the keyword search tool below to find specific information within the annual report.-
 1
1 -
2
-
3
-
4
-
5
-
6
-
7
-
8
-
9
-
10
-
11
-
12
-
13
-
14
-
15
-
16
-
17
-
18
-
19
-
20
-
21
-
22
-
23
-
24
-
25
-
26
-
 27
27 -
 28
28 -
 29
29 -
 30
30 -
 31
31 -
 32
32 -
 33
33 -
 34
34 -
 35
35 -
 36
36 -
 37
37 -
 38
38 -
 39
39 -
 40
40 -
 41
41 -
 42
42 -
 43
43 -
 44
44 -
 45
45 -
 46
46 -
 47
47 -
48
-
49
-
50
-
51
-
52
-
53
-
54
-
55
-
56
-
57
-
58
-
59
-
60
-
61
 |
 |
Annual Report 2004 35.
The company’s operating results for fiscal 2004 were in
line with initial projections. Taking this into account and
JVC’s goal of returning profits to shareholders in a sustain-
able and stable manner, the company has decided to pay a
year-end dividend of ¥5.0 per share.
LIQUIDITY AND SOURCES OF FUNDS
Assets, Liabilities and Capital
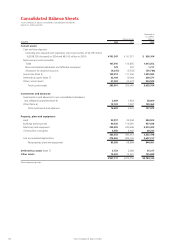
Total assets as of March 31, 2004 totaled ¥507.1 billion,
an increase of 5.7%, or ¥27.4 billion, compared to the
end of the previous fiscal year. This rise was mainly the
result of increases in cash and time deposits and inventories.
Total current assets rose 7.8%, or ¥27.7 billion, to
¥383.8 billion, primarily reflecting a 16.8%, or ¥18.7
billion, increase in inventories to ¥129.9 billion.
Investments and advances rose 78.7%, or ¥7.4 billion,
to ¥16.7 billion, chiefly due to the marking of investment
securities to market values.
Property, plant and equipment was 9.4%, or ¥9.3
billion, lower than the previous fiscal year-end, at ¥89.6
billion. This was mainly attributable to the sale of land and
other fixed assets.
¥2.8 billion, prior period patent royalty of ¥2.7 billion, and
other, net expenses of ¥2.3 billion. These items significantly
outweighed interest and dividend income of ¥0.7 billion,
gain on sales of investment securities of ¥0.3 billion, and a
substantial decline in loss from write-down of investment
in securities.
Income Before Income Taxes and
Minority Interests
Income before income taxes and minority interests increased
40.2%, or ¥4.0 billion, to ¥14.1 billion, due to improved
operating income and other factors.
Income Taxes
Income taxes decreased ¥5.5 billion, to negative ¥1.9
billion, representing an effective tax rate of negative
13.7%. The decline in income taxes was chiefly the result
of a lower tax rate used to calculate deferred tax assets.
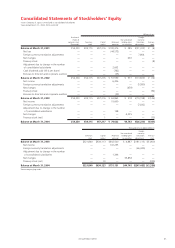
Net Income
Net income increased 146.4%, or ¥9.3 billion, to ¥15.6
billion, as benefits from changes to tax-effect accounting
outweighed other expenses such as restructuring charges.
Consequently, net income per share increased from ¥24.9
in the previous fiscal year, to ¥61.1, while ROE rose from
4.3%, to 9.8% in the year under review.