JVC 2004 Annual Report Download - page 38
Download and view the complete annual report
Please find page 38 of the 2004 JVC annual report below. You can navigate through the pages in the report by either clicking on the pages listed below, or by using the keyword search tool below to find specific information within the annual report.-
 1
1 -
2
-
3
-
4
-
5
-
6
-
7
-
8
-
9
-
10
-
11
-
12
-
13
-
14
-
15
-
16
-
17
-
18
-
19
-
20
-
21
-
22
-
23
-
24
-
25
-
26
-
27
-
 28
28 -
 29
29 -
 30
30 -
 31
31 -
 32
32 -
 33
33 -
 34
34 -
 35
35 -
 36
36 -
 37
37 -
 38
38 -
 39
39 -
 40
40 -
 41
41 -
 42
42 -
 43
43 -
 44
44 -
 45
45 -
 46
46 -
 47
47 -
 48
48 -
49
-
50
-
51
-
52
-
53
-
54
-
55
-
56
-
57
-
58
-
59
-
60
-
61
 |
 |

Victor Company of Japan, Limited36.
20000
10
20
30
40
20042001 2002 2003
20000
150
300
450
600
20042001 2002 2003
2000
0
10
20
30
40
50
20042001 2002 2003
(Billions of yen)(
Billions of yen)(Billions of yen)
Stockholders’ equity
Total assets
Depreciation & amortization
Capital expenditures
STOCKHOLDERS’ EQUITY/
TOTAL ASSETS
DEPRECIATION & AMORTIZATION/
CAPITAL EXPENDITURES
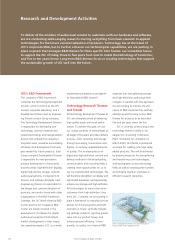
R&D EXPENDITURES
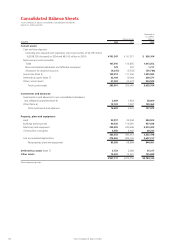
Total current liabilities were up 14.3%, or ¥29.7 billion,
compared to the end of the previous fiscal year, at ¥236.6
billion, reflecting an increase in notes and accounts payable—
trade and the reclassification of convertible bonds due
within one year.
Total long-term liabilities declined 12.4%, or ¥15.2
billion, to ¥107.1 billion, mainly due to the reclassification
of convertible bonds due within one year and a decline in
long-term debt.
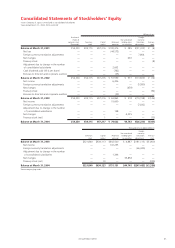
Stockholders’ equity was up 8.8%, or ¥12.9 billion, to
¥159.3 billion, while stockholders’ equity as a percentage
of total assets increased to 31.4%, compared with 30.5%
at the previous fiscal year-end.
Cash Flows
Operating activities provided net cash of ¥40.7 billion,
¥4.9 billion more than the previous fiscal year. Although
there was an increase in inventories of ¥23.5 billion, this
was offset by improvements in income before income
taxes and minority interests, as well as working capital and
other factors.
Net cash used by investing activities increased ¥3.4
billion, to ¥15.8 billion. This rise was mainly attributable to
an increase in cash used for purchases of property, plant
and equipment, partially offset by proceeds from sales of
property, plant and equipment.
Financing activities used net cash of ¥9.4 billion, ¥2.0
billion more than the previous fiscal year, primarily for
repayments of long-term loans and redemption of bonds.
As a result of the foregoing, cash and cash equivalents at
the end of the year stood at ¥97.2 billion, 16.6%, or ¥13.8
billion, higher than at the end of the previous fiscal year.