JVC 2004 Annual Report Download - page 4
Download and view the complete annual report
Please find page 4 of the 2004 JVC annual report below. You can navigate through the pages in the report by either clicking on the pages listed below, or by using the keyword search tool below to find specific information within the annual report.-
 1
1 -
 2
2 -
 3
3 -
 4
4 -
 5
5 -
 6
6 -
 7
7 -
 8
8 -
 9
9 -
 10
10 -
 11
11 -
 12
12 -
 13
13 -
 14
14 -
 15
15 -
16
-
17
-
18
-
19
-
20
-
21
-
22
-
23
-
24
-
25
-
26
-
27
-
28
-
29
-
30
-
31
-
32
-
33
-
34
-
35
-
36
-
37
-
38
-
39
-
40
-
41
-
42
-
43
-
44
-
45
-
46
-
47
-
48
-
49
-
50
-
51
-
52
-
53
-
54
-
55
-
56
-
57
-
58
-
59
-
60
-
61
 |
 |

2.
2000
0
200
400
600
800
1,000
20042001 2002 2003
2000
–20
–10
0
10
20
30
20042001 2002 2003
2000
–40
–20
0
20
40
20042001 2002 2003
–60
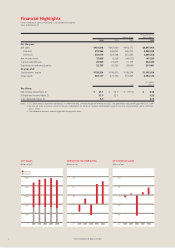
Victor Company of Japan, Limited
Financial Highlights
Victor Company of Japan, Limited and its consolidated subsidiaries
Years ended March 31
Thousands of U.S.
Millions of yen dollars (Note 1)
2004 2003 2002 2004
For the year:
Net sales ¥921,978 ¥967,640 ¥954,172 $8,697,906
Overseas 619,962 638,092 626,209 5,848,698
Domestic 302,016 329,548 327,963 2,849,208
Net income (loss) 15,609 6,336 (44,572) 147,255
Capital expenditures 25,900 21,036 21,175 244,340
Depreciation and amortization 22,735 25,250 28,000 214,481
At year-end:
Stockholders’ equity ¥159,326 ¥146,410 ¥146,246 $1,503,076
Total assets 507,117 479,750 513,365 4,784,123
U.S. dollars
Yen (Note 1)
Per share:
Net income (loss) (Note 2) ¥ 61.1 ¥ 24.9 ¥ (175.3) $ 0.58
Diluted net income (Note 2) 57.9 23.5 – 0.55
Cash dividends (Note 3) 5.0 –– 0.05
Notes: 1. U.S. dollar amounts have been translated, for convenience only, at the exchange rate of ¥106 to U.S.$1, the approximate rate prevailing on March 31, 2004.
2. Net loss per share of common stock for the year ended March 31, 2002 has not been recalculated using the new accounting standard, which is effective
April 1, 2002.
3. Cash dividends represent amounts applicable to respective years.
NET INCOME (LOSS)OPERATING INCOME (LOSS)NET SALES
(Billions of yen)(
Billions of yen)(Billions of yen)
Overseas
Domestic