JVC 2004 Annual Report Download - page 52
Download and view the complete annual report
Please find page 52 of the 2004 JVC annual report below. You can navigate through the pages in the report by either clicking on the pages listed below, or by using the keyword search tool below to find specific information within the annual report.-
 1
1 -
2
-
3
-
4
-
5
-
6
-
7
-
8
-
9
-
10
-
11
-
12
-
13
-
14
-
15
-
16
-
17
-
18
-
19
-
20
-
21
-
22
-
23
-
24
-
25
-
26
-
27
-
28
-
29
-
30
-
31
-
32
-
33
-
34
-
35
-
36
-
37
-
38
-
39
-
40
-
41
-
 42
42 -
 43
43 -
 44
44 -
 45
45 -
 46
46 -
 47
47 -
 48
48 -
 49
49 -
 50
50 -
 51
51 -
 52
52 -
 53
53 -
 54
54 -
 55
55 -
 56
56 -
 57
57 -
 58
58 -
 59
59 -
 60
60 -
 61
61
 |
 |

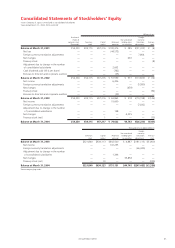
Victor Company of Japan, Limited50.
Thousands of U.S. dollars
Consumer Professional Components Software Eliminations
electronics electronics & Devices & Media Other and Consolidated
business business business business business Total unallocation total
2004:
Sales
External sales $6,019,726 $637,217 $585,236 $1,396,377 $ 59,350 $8,697,906 $ — $8,697,906
Intersegment sales 44,198 32,604 24,255 75,245 30,094 206,396 (206,396) –
Total sales 6,063,924 669,821 609,491 1,471,622 89,444 8,904,302 (206,396) 8,697,906
Operating expenses 5,820,358 686,490 638,877 1,427,755 77,171 8,650,651 (190,019) 8,460,632
Operating income (loss) $ 243,566 $ (16,669) $ (29,386) $ 43,867 $ 12,273 $ 253,651 $ (16,377) $ 237,274
Identifiable assets $2,478,189 $420,047 $356,245 $ 842,509 $223,124 $4,320,114 $ 464,009 $4,784,123
Depreciation & amortization 131,896 11,811 29,104 33,396 4,783 210,990 3,491 214,481
Capital expenditures 162,547 7,934 41,708 27,887 2,887 242,963 1,377 244,340
As explained in Note 3 “CHANGE IN ACCOUNTING METHOD”,
effective April 1, 2002, the Company changed the method of
accounting for royalty income. As a result, external sales, operating
expenses and operating income of Consumer electronics
business increased by ¥7,356 million ¥4,066 million, ¥3,290
million respectively.
2) Geographical segment information is as follows:
Millions of yen
Elimination
and Consolidated
Japan Americas Europe Asia Total unallocation total
2004:
Sales
External sales ¥352,485 ¥218,877 ¥243,061 ¥107,555 ¥ 921,978 ¥ — ¥921,978
Intersegment sales 271,194 965 1,638 193,209 467,006 (467,006) —
Total sales 623,679 219,842 244,699 300,764 1,388,984 (467,006) 921,978
Operating expenses 608,592 222,343 237,922 294,810 1,363,667 466,840 896,827
Operating income ¥ 15,087 ¥ (2,501) ¥ 6,777 ¥ 5,954 ¥ 25,317 ¥ 166 ¥ 25,151
Identifiable assets ¥318,387 ¥ 70,799 ¥ 89,361 ¥100,249 ¥ 578,796 ¥ (71,679) ¥507,117
Millions of yen
Elimination
and Consolidated
Japan Americas Europe Asia Total unallocation total
2003:
Sales
External sales ¥405,734 ¥259,043 ¥220,378 ¥ 82,485 ¥ 967,640 ¥ — ¥967,640
Intersegment sales 261,732 155 1,204 201,717 464,808 (464,808) —
Total sales 667,466 259,198 221,582 284,202 1,432,448 (464,808) 967,640
Operating expenses 656,536 256,500 215,806 279,253 1,408,095 (462,754) 945,341
Operating income ¥ 10,930 ¥ 2,698 ¥ 5,776 ¥ 4,949 ¥ 24,353 ¥ (2,054) ¥ 22,299
Identifiable assets ¥317,020 ¥ 78,768 ¥ 76,406 ¥ 87,126 ¥ 559,320 ¥ (79,570) ¥479,750
Millions of yen
Elimination
and Consolidated
Japan Americas Europe Asia Total unallocation total
2002:
Sales
External sales ¥397,635 ¥282,828 ¥191,591 ¥ 82,118 ¥ 954,172 ¥ — ¥954,172
Intersegment sales 246,654 248 1,036 166,361 414,299 (414,299) —
Total sales 644,289 283,076 192,627 248,479 1,368,471 (414,299) 954,172
Operating expenses 663,129 280,245 188,945 244,906 1,377,225 (410,959) 966,266
Operating income (loss) ¥ (18,840) ¥ 2,831 ¥ 3,682 ¥ 3,573 ¥ (8,754) ¥ (3,340) ¥ (12,094)
Identifiable assets ¥338,843 ¥ 93,275 ¥ 72,262 ¥ 75,958 ¥ 580,338 ¥ (66,973) ¥513,365