JVC 1999 Annual Report Download - page 31
Download and view the complete annual report
Please find page 31 of the 1999 JVC annual report below. You can navigate through the pages in the report by either clicking on the pages listed below, or by using the keyword search tool below to find specific information within the annual report.-
 1
1 -
2
-
3
-
4
-
5
-
6
-
7
-
8
-
9
-
10
-
11
-
12
-
13
-
14
-
15
-
16
-
17
-
18
-
19
-
20
-
 21
21 -
 22
22 -
 23
23 -
 24
24 -
 25
25 -
 26
26 -
 27
27 -
 28
28 -
 29
29 -
 30
30 -
 31
31 -
 32
32 -
 33
33 -
 34
34 -
 35
35 -
 36
36 -
 37
37 -
 38
38
 |
 |

JVC 1999 29
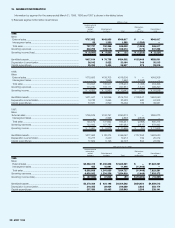
2) Geographical segment information is as follows: Millions of yen
Elimination
and Consolidated
Japan Americas Europe Asia Total unallocation total
1999:
Sales
External sales ................................ ¥474,911 ¥263,530 ¥156,044 ¥ 52,132 ¥ 946,617 ¥ — ¥946,617
Intersegment sales ........................ 246,614 798 146 122,817 370,375 (370,375) —
Total sales...................................... 721,525 264,328 156,190 174,949 1,316,992 (370,375) 946,617
Operating expenses......................... 718,296 265,448 155,913 175,655 1,315,312 (367,474) 947,838
Operating income (loss) ................... ¥ 3,229 ¥ (1,120) ¥ 277 ¥ (706) ¥ 1,680 ¥ (2,901) ¥ (1,221)
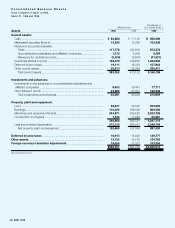
Identifiable assets ............................ ¥378,124 ¥ 93,712 ¥ 64,676 ¥ 59,943 ¥ 596,455 ¥ (8,454) ¥588,001
Millions of yen
Elimination
and Consolidated
Japan Americas Europe Asia Total unallocation total
1998:
Sales
External sales ................................ ¥496,970 ¥228,932 ¥137,625 ¥ 52,779 ¥ 916,306 ¥ — ¥916,306
Intersegment sales ........................ 217,691 1,572 73 103,222 322,558 (322,558) —
Total sales...................................... 714,661 230,504 137,698 156,001 1,238,864 (322,558) 916,306
Operating expenses......................... 705,765 231,694 135,660 154,860 1,227,979 (321,689) 906,290
Operating income (loss) ................... ¥ 8,896 ¥ (1,190) ¥ 2,038 ¥ 1,141 ¥ 10,885 ¥ (869) ¥ 10,016
Identifiable assets ............................ ¥394,610 ¥100,468 ¥ 69,601 ¥ 59,033 ¥ 623,712 ¥ 338 ¥624,050
Millions of yen
Elimination
and Consolidated
Japan Overseas Total unallocation total
1997:
Sales
External sales.............................. ¥516,911 ¥373,462 ¥ 890,373 ¥ — ¥890,373
Intersegment sales...................... 183,577 91,650 275,227 (275,227) —
Total sales................................... 700,488 465,112 1,165,600 (275,227) 890,373
Operating expenses...................... 690,153 461,893 1,152,046 (273,181) 878,865
Operating income ........................ ¥ 10,335 ¥ 3,219 ¥ 13,554 ¥ (2,046) ¥ 11,508
Identifiable assets.......................... ¥362,123 ¥199,058 ¥ 561,181 ¥ 42,739 ¥603,920
Thousands of U.S. dollars
Elimination
and Consolidated
Japan Americas Europe Asia Total unallocation total
1999:
Sales
External sales.............................. $3,924,884 $2,177,934 $1,289,620 $ 430,843 $7,823,281 $ — $7,823,281
Intersegment sales...................... 2,038,132 6,595 1,206 1,015,017 3,060,950 (3,060,950) —
Total sales................................... 5,963,016 2,184,529 1,290,826 1,445,860 10,884,231 (3,060,950) 7,823,281
Operating expenses...................... 5,936,330 2,193,785 1,288,537 $1,451,695 10,870,347 (3,036,975) 7,833,372
Operating income (loss)................. $ 26,686 $ (9,256) $ 2,289 $ (5,835) $ 13,884 $ (23,975) $ (10,091)
Identifiable assets.......................... $3,124,992 $ 774,479 $ 534,512 $ 495,397 $4,929,380 $ (69,868) $4,859,512
3) Overseas sales information by geographic area is as follows: Millions of yen
Americas Europe Asia Other area Total
1999
Overseas sales.................................................................................. ¥284,099 ¥165,320 ¥112,782 ¥4,350 ¥566,551
Consolidated sales............................................................................ ¥946,617
Percentage of overseas sales............................................................ 30.0% 17.5% 11.9% 0.5% 59.9%
1998
Overseas sales.................................................................................. ¥255,323 ¥145,698 ¥120,925 ¥4,339 ¥526,285
Consolidated sales............................................................................ ¥916,306
Percentage of overseas sales............................................................ 27.8% 15.9% 13.2% 0.5% 57.4%
Thousands of U.S. dollars
Americas Europe Asia Other area Total
1999
Overseas sales.................................................................................. $2,347,926 $1,336,281 $932,083 $35,950 $4,682,240
Consolidated sales............................................................................ $7,823,281
Percentage of overseas sales............................................................ 30.0% 17.5% 11.9% 0.5% 59.9%
Total overseas sales in 1997 were ¥484,394 million.