JVC 1999 Annual Report Download - page 17
Download and view the complete annual report
Please find page 17 of the 1999 JVC annual report below. You can navigate through the pages in the report by either clicking on the pages listed below, or by using the keyword search tool below to find specific information within the annual report.-
 1
1 -
2
-
3
-
4
-
5
-
6
-
 7
7 -
 8
8 -
 9
9 -
 10
10 -
 11
11 -
 12
12 -
 13
13 -
 14
14 -
 15
15 -
 16
16 -
 17
17 -
 18
18 -
 19
19 -
 20
20 -
 21
21 -
 22
22 -
 23
23 -
 24
24 -
 25
25 -
 26
26 -
 27
27 -
28
-
29
-
30
-
31
-
32
-
33
-
34
-
35
-
36
-
37
-
38
 |
 |

JVC 1999 15
Thousands of
Millions of yen U.S. dollars (Note A)
1999 1998 1997 1996 1995 1999
For the year
Net sales................................................... ¥946,617 ¥916,306 ¥890,373 ¥806,551 ¥767,218 $7,823,281
Overseas .............................................. 566,551 526,285 484,394 409,358 403,879 4,682,240
Domestic .............................................. 380,066 390,021 405,979 397,193 363,339 3,141,041
Cost of sales ............................................. 642,140 629,859 607,383 548,728 520,751 5,306,942
Selling, general and administrative
expenses ................................................. 305,698 276,431 271,482 252,815 246,547 2,526,430
Income (Loss) before income taxes
and minority interests ............................... (3,671) 6,223 12,139 10,148 7,099 (30,339)
Income taxes ............................................ 4,466 10,796 7,141 3,135 6,197 36,909
Net income (loss) ...................................... (8,315) (4,703) 4,586 4,343 591 (68,719)
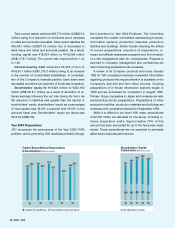
Depreciation & amortization ...................... 30,513 24,008 27,212 28,475 30,333 252,174
Capital expenditures ................................. 28,815 36,651 31,552 30,479 28,151 238,141
R&D expenditures..................................... 41,660 37,649 39,563 38,500 36,274 344,298
Thousands of
Millions of yen U.S. dollars (Note A)
At year-end
Working capital ......................................... ¥142,628 ¥124,395 ¥160,869 ¥123,357 ¥133,103 $1,178,744
Stockholders’ equity ................................. 232,162 243,086 250,418 247,891 242,745 1,918,694
Total assets............................................... 588,001 624,050 603,920 561,654 520,699 4,859,512
Yen U.S. dollars (Note A)
Per share
Net income (loss) ...................................... ¥ (32.7) ¥ (18.5) ¥ 18.0 ¥ 17.1 ¥ 2.3 $ (0.27)
Cash dividends (Note B) ........................... 5.0 7.0 7.0 5.0 — 0.04
Notes: A. U.S. dollar amounts have been translated, for convenience only, at the exchange rate of ¥121 to U.S.$1, the approximate rate prevailing on March 31, 1999.
B. Cash dividends represent amounts applicable to the respective years.
Five-Year Summary
Victor Company of Japan, Limited
Years ended March 31
Financial Contents
Five-Year Summary 15
Financial Review 16
Consolidated Statements of Operations 19
Consolidated Balance Sheets 20
Consolidated Statements of Stockholders’ Equity 22
Consolidated Statements of Cash Flows 23
Notes to Consolidated Financial Statements 24
Report of Independent Public Accountants 30