JVC 1999 Annual Report Download - page 30
Download and view the complete annual report
Please find page 30 of the 1999 JVC annual report below. You can navigate through the pages in the report by either clicking on the pages listed below, or by using the keyword search tool below to find specific information within the annual report.-
 1
1 -
2
-
3
-
4
-
5
-
6
-
7
-
8
-
9
-
10
-
11
-
12
-
13
-
14
-
15
-
16
-
17
-
18
-
19
-
 20
20 -
 21
21 -
 22
22 -
 23
23 -
 24
24 -
 25
25 -
 26
26 -
 27
27 -
 28
28 -
 29
29 -
 30
30 -
 31
31 -
 32
32 -
 33
33 -
 34
34 -
 35
35 -
 36
36 -
 37
37 -
 38
38
 |
 |

28 JVC 1999
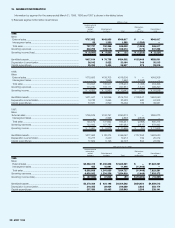
15. SEGMENT INFORMATION
Information by segment for the years ended March 31, 1999, 1998 and 1997 is shown in the tables below.
1) Business segment information is as follows: Millions of yen
Audiovisual and
information- Eliminations
related Entertainment and Consolidated
business business Total unallocation total
1999:
Sales
External sales .................................................................................. ¥797,682 ¥148,935 ¥946,617 ¥ — ¥946,617
Intersegment sales .......................................................................... 55 1,330 1,385 (1,385) —
Total sales ....................................................................................... 797,737 150,265 948,002 (1,385) 946,617
Operating expenses .......................................................................... 802,298 145,715 948,013 (175) 947,838
Operating income (loss)..................................................................... ¥ (4,561) ¥ 4,550 ¥ (11) ¥ (1,210) ¥ (1,221)
Identifiable assets.............................................................................. ¥407,814 ¥ 76,738 ¥484,552 ¥103,449 ¥588,001
Depreciation & amortization............................................................... 26,542 3,622 30,164 349 30,513
Capital expenditures.......................................................................... 25,093 3,444 28,537 278 28,815
1998:
Sales
External sales .................................................................................. ¥779,603 ¥136,703 ¥916,306 ¥ — ¥916,306
Intersegment sales .......................................................................... — 1,968 1,968 (1,968) —
Total sales ....................................................................................... 779,603 138,671 918,274 (1,968) 916,306
Operating expenses .......................................................................... 774,720 133,111 907,831 (1,541) 906,290
Operating income ............................................................................. ¥ 4,883 ¥ 5,560 ¥ 10,443 ¥ (427) ¥ 10,016
Identifiable assets.............................................................................. ¥431,647 ¥ 84,056 ¥515,703 ¥108,347 ¥624,050
Depreciation & amortization............................................................... 19,733 3,695 23,428 580 24,008
Capital expenditures.......................................................................... 33,637 2,829 36,466 185 36,651
1997:
Sales
External sales ................................................................................... ¥755,576 ¥134,797 ¥890,373 ¥ — ¥890,373
Intersegment sales .......................................................................... — 2,868 2,868 (2,868) —
Total sales ....................................................................................... 755,576 137,665 893,241 (2,868) 890,373
Operating expenses .......................................................................... 753,895 127,787 881,682 (2,817) 878,865
Operating income ............................................................................. ¥ 1,681 ¥ 9,878 ¥ 11,559 ¥ (51) ¥ 11,508
Identifiable assets.............................................................................. ¥377,693 ¥ 88,374 ¥466,067 ¥137,853 ¥603,920
Depreciation & amortization............................................................... 15,273 3,940 19,213 799 20,012
Capital expenditures.......................................................................... 17,622 5,126 22,748 804 23,552
Thousands of U.S. dollars
Audiovisual and
information- Eliminations
related Entertainment and Consolidated
business business Total unallocation total
1999:
Sales
External sales .................................................................................. $6,592,413 $1,230,868 $7,823,281 $ — $7,823,281
Intersegment sales .......................................................................... 455 10,991 11,446 (11,446) —
Total sales ....................................................................................... 6,592,868 1,241,859 7,834,727 (11,446) 7,823,281
Operating expenses .......................................................................... 6,630,562 1,204,256 7,834,818 (1,446) 7,833,372
Operating income (loss)..................................................................... $ (37,694) $ 37,603 $ (91) $ (10,000) $ (10,091)
Identifiable assets.............................................................................. $3,370,364 $ 634,198 $4,004,562 $854,950 $4,859,512
Depreciation & amortization............................................................... 219,355 29,934 249,289 2,885 252,174
Capital expenditures.......................................................................... 207,380 28,463 235,843 2,298 238,141