JVC 1999 Annual Report Download - page 2
Download and view the complete annual report
Please find page 2 of the 1999 JVC annual report below. You can navigate through the pages in the report by either clicking on the pages listed below, or by using the keyword search tool below to find specific information within the annual report.-
 1
1 -
 2
2 -
 3
3 -
 4
4 -
 5
5 -
 6
6 -
 7
7 -
 8
8 -
 9
9 -
 10
10 -
 11
11 -
 12
12 -
 13
13 -
14
-
15
-
16
-
17
-
18
-
19
-
20
-
21
-
22
-
23
-
24
-
25
-
26
-
27
-
28
-
29
-
30
-
31
-
32
-
33
-
34
-
35
-
36
-
37
-
38
 |
 |

Financial Highlights
Victor Company of Japan, Limited
Thousands of
Millions of yen U.S. dollars (Note A)
1999 1998 1997 1999
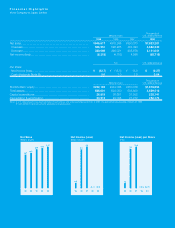
Net sales........................................................................................ ¥946,617 ¥916,306 ¥890,373 $7,823,281
Overseas...................................................................................... 566,551 526,285 484,394 4,682,240
Domestic...................................................................................... 380,066 390,021 405,979 3,141,041
Net income (loss)............................................................................ (8,315) (4,703) 4,586 (68,719)
Yen U.S. dollars (Note A)
Per share:
Net income (loss).......................................................................... ¥ (32.7) ¥ (18.5) ¥ 18.0 $ (0.27)
Cash dividends (Note B)............................................................... 5.0 7.0 7.0 0.04
Thousands of
Millions of yen U.S. dollars (Note A)
Stockholders’ equity ...................................................................... ¥232,162 ¥243,086 ¥250,418 $1,918,694
Total assets.................................................................................... 588,001 624,050 603,920 4,859,512
Capital expenditures ...................................................................... 28,815 36,651 31,552 238,141
Depreciation & amortization ........................................................... 30,513 24,008 27,212 252,174
Notes: A. U.S. dollar amounts have been translated, for convenience only, at the exchange rate of ¥121 to US$1, the approximate rate prevailing on March 31, 1999.
B. Cash dividends represent amounts applicable to respective years.
767 807
890 947
916
2.3
17.1 18.0
(32.7)(18.5)
0.6
4.3 4.6
(8.3)(4.7)
95
Net Income (Loss) per Share
(Yen)
Net Income (Loss)
(Billions of yen)
Net Sales
(Billions of yen)
96 97 98 99 95 96 97 98 99 95 96 97 98 99