JVC 1999 Annual Report Download - page 25
Download and view the complete annual report
Please find page 25 of the 1999 JVC annual report below. You can navigate through the pages in the report by either clicking on the pages listed below, or by using the keyword search tool below to find specific information within the annual report.-
 1
1 -
2
-
3
-
4
-
5
-
6
-
7
-
8
-
9
-
10
-
11
-
12
-
13
-
14
-
 15
15 -
 16
16 -
 17
17 -
 18
18 -
 19
19 -
 20
20 -
 21
21 -
 22
22 -
 23
23 -
 24
24 -
 25
25 -
 26
26 -
 27
27 -
 28
28 -
 29
29 -
 30
30 -
 31
31 -
 32
32 -
 33
33 -
 34
34 -
 35
35 -
36
-
37
-
38
 |
 |

JVC 1999 23
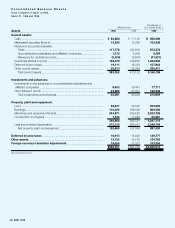
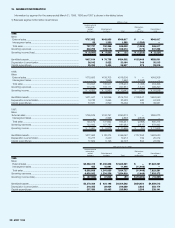
Thousands of
Millions of yen U.S. dollars (Note 1)
1999 1998 1997 1999
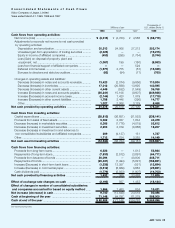
Cash flows from operating activities:
Net income (loss) ........................................................................ ¥ (8,315) ¥ (4,703) ¥ 4,586 $ (68,719)
Adjustments to reconcile net income to net cash provided
by operating activities:
Depreciation and amortization ................................................ 30,513 24,008 27,212 252,174
Unrealized gain from appreciation of trading securities ........... (2,325) ——(19,215)
Equity in income of affiliated companies ................................. (453) (295) (1,754) (3,744)
Loss (Gain) on disposal of property, plant and
equipment, net ...................................................................... (1,087) 199 (180) (8,983)
Loss from financial support of affiliated companies................. —— 529 —
Deferred income taxes............................................................ (1,977) 3,755 (57) (16,339)
Bonuses to directors and statutory auditors ........................... (92) (94) (71) (760)
Changes in operating assets and liabilities:
Decrease (Increase) in notes and accounts receivable............ 13,423 (2,074) (9,666) 110,934
Decrease (Increase) in inventories........................................... 17,012 (20,689) 13,695 140,595
Decrease (Increase) in other current assets ............................ 4,449 (532) (1,549) 36,768
Increase (Decrease) in notes and accounts payable ............... (30,241) 15,108 (9,607) (249,926)
Increase (Decrease) in accrued income taxes......................... (2,144) 1,420 1,079 (17,719)
Increase (Decrease) in other current liabilities.......................... 1,788 2,448 (290) 14,777
Other ...................................................................................... 1,027 2,068 3,179 8,488
Net cash provided by operating activities ............................... 21,578 20,619 27,106 178,331
Cash flows from investing activities:
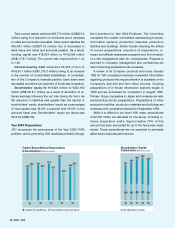
Capital expenditures ................................................................... (28,815) (36,651) (31,552) (238,141)
Proceeds from sales of fixed assets............................................ 5,382 2,027 1,834 44,479
Decrease (Increase) in marketable securities............................... 6,366 (1,776) (4,019) 52,612
Decrease (Increase) in investment securities ............................... 2,203 3,079 (8,866) 18,207
Decrease (Increase) in investment in and advances to
non-consolidated subsidiaries and affiliated companies............. 209 (4,137) 151 1,727
Other........................................................................................... 1,712 754 3,285 14,149
Net cash used in investing activities ........................................ (12,943) (36,704) (39,167) (106,967)
Cash flows from financing activities:
Proceeds from long-term loans................................................... 6,526 — 1,813 53,934
Repayments of long-term loans.................................................. (7,830) (2,572) (3,697) (64,711)
Proceeds from issuance of bonds .............................................. 30,094 — 40,000 248,711
Repayments of bonds................................................................. (20,431) (1,494) (5,827) (168,851)
Increase (Decrease) in short-term bank loans ............................. (1,536) 13,357 (551) (12,694)
Increase (Decrease) in commercial paper.................................... (3,612) (6,869) 3,662 (29,851)
Cash dividends paid ................................................................... (1,779) (2,033) (1,907) (14,703)
Net cash provided by financing activities ................................ 1,432 389 33,493 11,835
Effect of exchange rate changes on cash ............................... (2,193) 567 1,452 (18,124)
Effect of changes in number of consolidated subsidiaries
and companies accounted for based on equity method ....... 1,866 1,480 634 15,421
Net increase (decrease) in cash ................................................ 9,740 (13,649) 23,518 80,496
Cash at beginning of the year ................................................... 71,148 84,797 61,279 588,000
Cash at end of the year .............................................................. ¥ 80,888 ¥ 71,148 ¥ 84,797 $ 668,496
See accompanying notes.
Consolidated Statements of Cash Flows
Victor Company of Japan, Limited
Years ended March 31, 1999, 1998 and 1997