JVC 1999 Annual Report Download - page 21
Download and view the complete annual report
Please find page 21 of the 1999 JVC annual report below. You can navigate through the pages in the report by either clicking on the pages listed below, or by using the keyword search tool below to find specific information within the annual report.-
 1
1 -
2
-
3
-
4
-
5
-
6
-
7
-
8
-
9
-
10
-
 11
11 -
 12
12 -
 13
13 -
 14
14 -
 15
15 -
 16
16 -
 17
17 -
 18
18 -
 19
19 -
 20
20 -
 21
21 -
 22
22 -
 23
23 -
 24
24 -
 25
25 -
 26
26 -
 27
27 -
 28
28 -
 29
29 -
 30
30 -
 31
31 -
32
-
33
-
34
-
35
-
36
-
37
-
38
 |
 |

JVC 1999 19
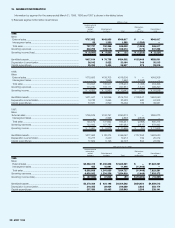
Thousands of
Millions of yen U.S. dollars (Note 1)
1999 1998 1997 1999
Net sales ...................................................................................... ¥946,617 ¥916,306 ¥890,373 $7,823,281
Costs and expenses:
Cost of sales............................................................................... 642,140 629,859 607,383 5,306,942
Selling, general and administrative expenses .............................. 305,698 276,431 271,482 2,526,430
............................................................................................... 947,838 906,290 878,865 7,833,372
Operating income (loss) .............................................................. (1,221) 10,016 11,508 (10,091)
Other income (expenses):
Interest and dividend income...................................................... 2,407 1,937 2,418 19,893
Unrealized gain from appreciation of trading securities ............... 2,325 ——19,215
Equity in income of affiliated companies (Note 6) ........................ 453 295 1,754 3,744
Interest expense.......................................................................... (8,379) (5,246) (4,864) (69,248)
Gain on sales of investment securities ........................................ 530 893 34 4,380
Loss on liquidation of subsidiaries............................................... (2,293) — (364) (18,950)
Loss from financial support of affiliated companies ..................... (1,122) (1,356) (1,022) (9,273)
Restructuring charges................................................................. (537) (2,063) — (4,438)
Other, net.................................................................................... 4,166 1,747 2,676 34,429
............................................................................................... (2,450) (3,793) 631 (20,248)
Income (Loss) before income taxes
and minority interests................................................................. (3,671) 6,223 12,139 (30,339)
Income taxes (Note 7):
Current........................................................................................ 6,443 7,488 6,624 53,248
Deferred...................................................................................... (1,977) 3,308 517 (16,339)
............................................................................................... 4,466 10,796 7,141 36,909
Income (Loss) before minority interests .................................. (8,137) (4,573) 4,998 (67,248)
Minority interests ........................................................................ (178) (130) (413) (1,471)
Net income (loss) ......................................................................... ¥ (8,315) ¥ (4,703) ¥ 4,586 $ (68,719)
Yen U.S. dollars (Note 2)
Amounts per share of common stock:
Net income (loss) ........................................................................ ¥ (32.7) ¥ (18.5) ¥ 18.0 $ (0.27)
Diluted net income...................................................................... —— 17.2 —
Cash dividends applicable to the year ........................................ 5.0 7.0 7.0 0.04
See accompanying notes.
Consolidated Statements of Operations
Victor Company of Japan, Limited
Years ended March 31, 1999, 1998 and 1997