Hasbro 2008 Annual Report Download - page 85
Download and view the complete annual report
Please find page 85 of the 2008 Hasbro annual report below. You can navigate through the pages in the report by either clicking on the pages listed below, or by using the keyword search tool below to find specific information within the annual report.-
 1
1 -
2
-
3
-
4
-
5
-
6
-
7
-
8
-
9
-
10
-
11
-
12
-
13
-
14
-
15
-
16
-
17
-
18
-
19
-
20
-
21
-
22
-
23
-
24
-
25
-
26
-
27
-
28
-
29
-
30
-
31
-
32
-
33
-
34
-
35
-
36
-
37
-
38
-
39
-
40
-
41
-
42
-
43
-
44
-
45
-
46
-
47
-
48
-
49
-
50
-
51
-
52
-
53
-
54
-
55
-
56
-
57
-
58
-
59
-
60
-
61
-
62
-
63
-
64
-
65
-
66
-
67
-
68
-
69
-
70
-
71
-
72
-
73
-
74
-
 75
75 -
 76
76 -
 77
77 -
 78
78 -
 79
79 -
 80
80 -
 81
81 -
 82
82 -
 83
83 -
 84
84 -
 85
85 -
 86
86 -
 87
87 -
 88
88 -
 89
89 -
 90
90 -
 91
91 -
 92
92 -
 93
93 -
 94
94 -
 95
95 -
96
-
97
-
98
-
99
-
100
 |
 |

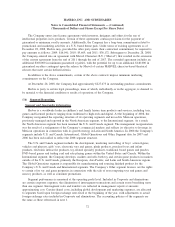
necessary. However, if the Company were prevented from obtaining products from a substantial number of its
current Far East suppliers due to political, labor or other factors beyond its control, the Company’s operations
would be disrupted, potentially for a significant period of time, while alternative sources of product were
secured. The imposition of trade sanctions by the United States or the European Union against a class of
products imported by Hasbro from, or the loss of “normal trade relations” status by, the People’s Republic of
China could significantly increase the cost of the Company’s products imported into the United States or
Europe.
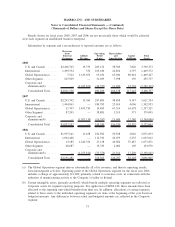
(17) Quarterly Financial Data (Unaudited)
First Second Third Fourth Full Year
Quarter
2008
Net revenues ................... $704,220 784,286 1,301,961 1,231,053 4,021,520
Gross profit ................... 433,059 476,064 728,126 691,543 2,328,792
Earnings before income taxes ...... 55,670 55,285 201,520 128,580 441,055
Net earnings ................... 37,470 37,486 138,229 93,581 306,766
Per common share
Net earnings
Basic ..................... $ 0.26 0.27 0.98 0.67 2.18
Diluted ................... 0.25 0.25 0.89 0.62 2.00
Market price
High ..................... $ 29.07 39.63 41.68 35.81 41.68
Low ..................... 21.57 27.73 33.23 21.94 21.57
Cash dividends declared ........ $ 0.20 0.20 0.20 0.20 0.80
First Second Third Fourth Full Year
Quarter
2007
Net revenues ................... $625,267 691,408 1,223,038 1,297,844 3,837,557
Gross profit ................... 381,815 418,196 702,016 758,909 2,260,936
Earnings before income taxes ...... 49,600 21,961 203,921 186,900 462,382
Net earnings ................... 32,890 4,801 161,580 133,732 333,003
Per common share
Net earnings
Basic ..................... $ 0.20 0.03 1.04 0.91 2.13
Diluted ................... 0.19 0.03 0.95 0.84 1.97
Market price
High ..................... $ 30.24 33.43 33.49 30.68 33.49
Low ..................... 27.04 28.10 25.25 25.25 25.25
Cash dividends declared ........ $ 0.16 0.16 0.16 0.16 0.64
75
HASBRO, INC. AND SUBSIDIARIES
Notes to Consolidated Financial Statements — (Continued)
(Thousands of Dollars and Shares Except Per Share Data)