Hasbro 2008 Annual Report Download - page 34
Download and view the complete annual report
Please find page 34 of the 2008 Hasbro annual report below. You can navigate through the pages in the report by either clicking on the pages listed below, or by using the keyword search tool below to find specific information within the annual report.-
 1
1 -
2
-
3
-
4
-
5
-
6
-
7
-
8
-
9
-
10
-
11
-
12
-
13
-
14
-
15
-
16
-
17
-
18
-
19
-
20
-
21
-
22
-
23
-
 24
24 -
 25
25 -
 26
26 -
 27
27 -
 28
28 -
 29
29 -
 30
30 -
 31
31 -
 32
32 -
 33
33 -
 34
34 -
 35
35 -
 36
36 -
 37
37 -
 38
38 -
 39
39 -
 40
40 -
 41
41 -
 42
42 -
 43
43 -
 44
44 -
45
-
46
-
47
-
48
-
49
-
50
-
51
-
52
-
53
-
54
-
55
-
56
-
57
-
58
-
59
-
60
-
61
-
62
-
63
-
64
-
65
-
66
-
67
-
68
-
69
-
70
-
71
-
72
-
73
-
74
-
75
-
76
-
77
-
78
-
79
-
80
-
81
-
82
-
83
-
84
-
85
-
86
-
87
-
88
-
89
-
90
-
91
-
92
-
93
-
94
-
95
-
96
-
97
-
98
-
99
-
100
 |
 |

Net earnings for the fiscal year ended December 28, 2008 were $306,766, or $2.00 per diluted share. This
compares to net earnings for fiscal 2007 and 2006 of $333,003 and $230,055, or $1.97 and $1.29 per diluted
share, respectively.
Net earnings includes non-operating expense related to the change in fair value of certain warrants
required to be classified as a liability of $44,370 in 2007 and $31,770 in 2006. These warrants were
repurchased during May 2007. Net earnings for 2007 also includes a favorable tax adjustment of $29,619, or
$0.17 per diluted share, related to the recognition of certain previously unrecognized tax benefits.
In January 2008 the Company acquired Cranium, Inc. (“Cranium”). The results of operations for 2008
include the operations of Cranium from the acquisition closing date of January 25, 2008.
Consolidated net revenues for the year ended December 28, 2008 were $4,021,520 compared to
$3,837,557 in 2007 and $3,151,481 in 2006. Most of the Company’s net revenues and operating profits were
derived from its two principal segments: the U.S. and Canada segment and the International segment, which
are discussed in detail below. Consolidated net revenues in 2008 were negatively impacted by foreign currency
translation of approximately $10,300 as a result of the stronger U.S. dollar in 2008 as compared to 2007 while
consolidated net revenues in 2007 were positively impacted by foreign currency translation in the amount of
$94,500 as a result of the overall weaker U.S. dollar in that year.
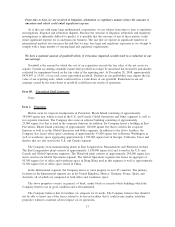
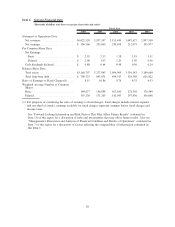
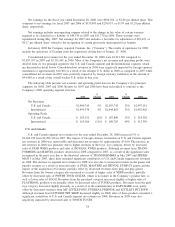
The following table presents net revenues and operating profit data for the Company’s two principal
segments for 2008, 2007 and 2006. Results for 2007 and 2006 have been reclassified to conform to the
Company’s 2008 operating segment structure.
2008
%
Change 2007
%
Change 2006
Net Revenues
U.S. and Canada .............. $2,406,745 5% $2,293,742 15% $1,997,141
International .................. $1,499,334 4% $1,444,863 32% $1,092,468
Operating Profit
U.S. and Canada .............. $ 283,152 (2)% $ 287,800 13% $ 254,502
International .................. $ 165,186 (13)% $ 189,783 69% $ 112,350
U.S. and Canada
U.S. and Canada segment net revenues for the year ended December 28, 2008 increased 5% to
$2,406,745 from $2,293,742 in 2007. The impact of foreign currency translation on U.S. and Canada segment
net revenues in 2008 was unfavorable and decreased net revenues by approximately $3,100. The increase in
net revenues in 2008 was primarily due to higher revenues in the boys’ toys category, driven by increased
sales of STAR WARS products and sales of INDIANA JONES products. Although revenues from TRANS-
FORMERS and MARVEL products decreased in 2008 compared to 2007, as a result of the significant sales
recognized in the prior year due to the theatrical releases of TRANSFORMERS in July 2007 and SPIDER-
MAN 3 in May 2007, these lines remained significant contributors to U.S. and Canada segment net revenues
in 2008. The increase in segment net revenues for 2008 was also due to increased revenues in the games and
puzzles category as a result of increased sales of DUEL MASTERS and TRIVIAL PURSUIT games and the
impact of the acquisition of Cranium, partially offset by decreased revenues from plug and play games.
Revenues from the tweens category also increased as a result of higher sales of NERF products, partially
offset by decreased sales of POWER TOUR GUITAR, which is no longer in the Company’s product line, as
well as lower sales of I-DOG. Revenues from the preschool category increased slightly as higher sales of
PLAYSKOOL products were partially offset by decreased sales of TONKA products. Revenues from the girls’
toys category increased slightly primarily as a result of of the reintroduction of EASY-BAKE oven, partly
offset by decreased revenues from MY LITTLE PONY, FURREAL FRIENDS, and LITTLEST PET SHOP.
Although revenues from LITTLEST PET SHOP decreased slightly in 2008, sales of these products remained a
significant contributor to U.S. and Canada segment net revenues in 2008. Revenues in 2008 were also
negatively impacted by decreased sales of TOOTH TUNES.
24