Hasbro 2008 Annual Report Download - page 84
Download and view the complete annual report
Please find page 84 of the 2008 Hasbro annual report below. You can navigate through the pages in the report by either clicking on the pages listed below, or by using the keyword search tool below to find specific information within the annual report.-
 1
1 -
2
-
3
-
4
-
5
-
6
-
7
-
8
-
9
-
10
-
11
-
12
-
13
-
14
-
15
-
16
-
17
-
18
-
19
-
20
-
21
-
22
-
23
-
24
-
25
-
26
-
27
-
28
-
29
-
30
-
31
-
32
-
33
-
34
-
35
-
36
-
37
-
38
-
39
-
40
-
41
-
42
-
43
-
44
-
45
-
46
-
47
-
48
-
49
-
50
-
51
-
52
-
53
-
54
-
55
-
56
-
57
-
58
-
59
-
60
-
61
-
62
-
63
-
64
-
65
-
66
-
67
-
68
-
69
-
70
-
71
-
72
-
73
-
 74
74 -
 75
75 -
 76
76 -
 77
77 -
 78
78 -
 79
79 -
 80
80 -
 81
81 -
 82
82 -
 83
83 -
 84
84 -
 85
85 -
 86
86 -
 87
87 -
 88
88 -
 89
89 -
 90
90 -
 91
91 -
 92
92 -
 93
93 -
 94
94 -
95
-
96
-
97
-
98
-
99
-
100
 |
 |

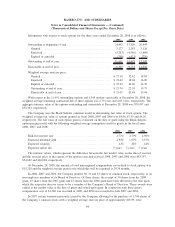
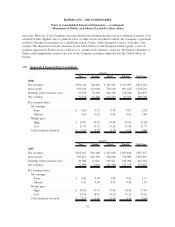
The following table presents consolidated net revenues by classes of principal products for the three fiscal
years ended December 28, 2008:
2008 2007 2006
Games and puzzles ............................... $1,315,423 1,323,641 1,294,110
Boys’ toys ...................................... 1,083,342 1,024,023 575,841
Girls’ toys ...................................... 790,503 697,304 540,298
Preschool toys ................................... 480,694 434,893 406,663
Tweens toys .................................... 270,160 252,055 266,844
Other ......................................... 81,398 105,641 67,725
Net revenues .................................... $4,021,520 3,837,557 3,151,481
No individual product lines accounted for 10% or more of consolidated net revenues during 2008 or
2006. During 2007, revenues from TRANSFORMERS products accounted for 12.6% of consolidated net
revenues. No other individual product lines accounted for 10% or more of consolidated net revenues in 2007.
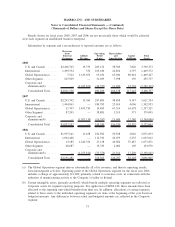
Information as to Hasbro’s operations in different geographical areas is presented below on the basis the
Company uses to manage its business. Net revenues are categorized based on location of the customer, while
long-lived assets (property, plant and equipment, goodwill and other intangibles) are categorized based on their
location:
2008 2007 2006
Net revenues
United States .................................. $2,339,171 2,210,840 1,898,865
International .................................. 1,682,349 1,626,717 1,252,616
$4,021,520 3,837,557 3,151,481
Long-lived assets
United States .................................. $1,079,908 1,011,660 1,051,124
International .................................. 174,708 133,709 132,797
$1,254,616 1,145,369 1,183,921
Principal international markets include Europe, Canada, Mexico, Australia, and Hong Kong.
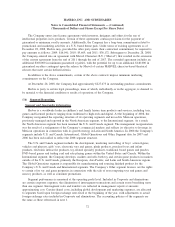
Other Information
Hasbro markets its products primarily to customers in the retail sector. Although the Company closely
monitors the creditworthiness of its customers, adjusting credit policies and limits as deemed appropriate, a
substantial portion of its customers’ ability to discharge amounts owed is generally dependent upon the overall
retail economic environment.
Sales to the Company’s three largest customers, Wal-Mart Stores, Inc., Target Corporation and Toys “R”
Us, Inc., amounted to 25%, 12% and 10%, respectively, of consolidated net revenues during 2008, 24%, 12%
and 11% during 2007 and 24%, 13% and 11% during 2006. These net revenues were primarily related to the
U.S. and Canada segment.
Hasbro purchases certain components used in its manufacturing process and certain finished products
from manufacturers in the Far East. The Company’s reliance on external sources of manufacturing can be
shifted, over a period of time, to alternative sources of supply for products it sells, should such changes be
74
HASBRO, INC. AND SUBSIDIARIES
Notes to Consolidated Financial Statements — (Continued)
(Thousands of Dollars and Shares Except Per Share Data)