Hasbro 2008 Annual Report Download - page 33
Download and view the complete annual report
Please find page 33 of the 2008 Hasbro annual report below. You can navigate through the pages in the report by either clicking on the pages listed below, or by using the keyword search tool below to find specific information within the annual report.-
 1
1 -
2
-
3
-
4
-
5
-
6
-
7
-
8
-
9
-
10
-
11
-
12
-
13
-
14
-
15
-
16
-
17
-
18
-
19
-
20
-
21
-
22
-
 23
23 -
 24
24 -
 25
25 -
 26
26 -
 27
27 -
 28
28 -
 29
29 -
 30
30 -
 31
31 -
 32
32 -
 33
33 -
 34
34 -
 35
35 -
 36
36 -
 37
37 -
 38
38 -
 39
39 -
 40
40 -
 41
41 -
 42
42 -
 43
43 -
44
-
45
-
46
-
47
-
48
-
49
-
50
-
51
-
52
-
53
-
54
-
55
-
56
-
57
-
58
-
59
-
60
-
61
-
62
-
63
-
64
-
65
-
66
-
67
-
68
-
69
-
70
-
71
-
72
-
73
-
74
-
75
-
76
-
77
-
78
-
79
-
80
-
81
-
82
-
83
-
84
-
85
-
86
-
87
-
88
-
89
-
90
-
91
-
92
-
93
-
94
-
95
-
96
-
97
-
98
-
99
-
100
 |
 |

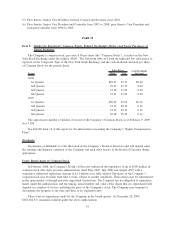
(the “Board”) has adopted four share repurchase authorizations with a cumulative authorized repurchase
amount of $1,700,000. After fully exhausting the prior three authorizations, the fourth authorization was
approved on February 7, 2008 for $500,000. For the years ended 2008, 2007 and 2006, the Company spent
$357,589, $587,004 and $456,744, respectively, to repurchase 11,736, 20,795 and 22,767 shares, respectively,
in the open market. Also in 2007, the Company paid $200,000 in cash to repurchase exercisable warrants for
15,750 shares of the Company’s common stock. The Company intends to, at its discretion, opportunistically
repurchase shares in the future subject to market conditions. At December 28, 2008, the Company had
$252,364 remaining under the February 2008 authorization.
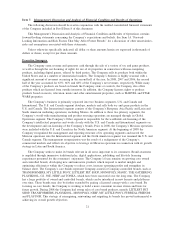
After a very strong first nine months of 2008, the Company was negatively impacted during the fourth
quarter of 2008 by both the strengthening of the U.S. dollar relative to foreign currencies as well as the broad
based economic downturn that was experienced in most of the markets in which it operates. The Company
worked with its retail customers to put certain promotional programs in place with the goal of both driving
sales as well as managing inventory at retail given the weakening demand. Despite the impact of the economic
conditions, the Company grew revenue in both the fourth quarter and for the full year absent the impact of
foreign exchange rate changes in 2008.
Recent issues in the credit markets have not materially impacted the Company’s liquidity. As of
December 28, 2008 the Company had $630,390 in cash and had available capacity, if needed, under its
revolving credit agreement. The Company believes that the funds available to it, including cash expected to be
generated from operations and funds available through its available lines of credit and accounts receivable
securitization program are adequate to meet its working capital needs for 2009.
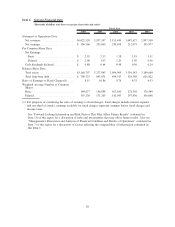
Summary
The components of the results of operations, stated as a percent of net revenues, are illustrated below for
each of the three fiscal years ended December 28, 2008.
2008 2007 2006
Net revenues .............................................. 100.0% 100.0% 100.0%
Cost of sales .............................................. 42.1 41.1 41.4
Gross profit ............................................... 57.9 58.9 58.6
Amortization .............................................. 1.9 1.8 2.5
Royalties ................................................. 7.8 8.2 5.4
Research and product development .............................. 4.8 4.4 5.4
Advertising ............................................... 11.3 11.3 11.7
Selling, distribution and administration ........................... 19.8 19.7 21.7
Operating profit ............................................ 12.3 13.5 11.9
Interest expense ............................................ 1.2 0.9 0.9
Interest income............................................. (0.5) (0.8) (0.9)
Other (income) expense, net ................................... 0.6 1.4 1.1
Earnings before income taxes .................................. 11.0 12.0 10.8
Income taxes .............................................. 3.4 3.3 3.5
Net earnings ............................................... 7.6% 8.7% 7.3%
Results of Operations
The fiscal years ended December 28, 2008 and December 30, 2007 were fifty-two week periods while the
fiscal year ended December 31, 2006 was a fifty-three week period.
23