Hasbro 2008 Annual Report Download - page 52
Download and view the complete annual report
Please find page 52 of the 2008 Hasbro annual report below. You can navigate through the pages in the report by either clicking on the pages listed below, or by using the keyword search tool below to find specific information within the annual report.-
 1
1 -
2
-
3
-
4
-
5
-
6
-
7
-
8
-
9
-
10
-
11
-
12
-
13
-
14
-
15
-
16
-
17
-
18
-
19
-
20
-
21
-
22
-
23
-
24
-
25
-
26
-
27
-
28
-
29
-
30
-
31
-
32
-
33
-
34
-
35
-
36
-
37
-
38
-
39
-
40
-
41
-
 42
42 -
 43
43 -
 44
44 -
 45
45 -
 46
46 -
 47
47 -
 48
48 -
 49
49 -
 50
50 -
 51
51 -
 52
52 -
 53
53 -
 54
54 -
 55
55 -
 56
56 -
 57
57 -
 58
58 -
 59
59 -
 60
60 -
 61
61 -
 62
62 -
63
-
64
-
65
-
66
-
67
-
68
-
69
-
70
-
71
-
72
-
73
-
74
-
75
-
76
-
77
-
78
-
79
-
80
-
81
-
82
-
83
-
84
-
85
-
86
-
87
-
88
-
89
-
90
-
91
-
92
-
93
-
94
-
95
-
96
-
97
-
98
-
99
-
100
 |
 |

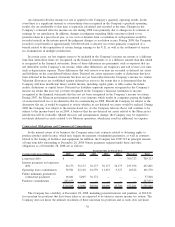
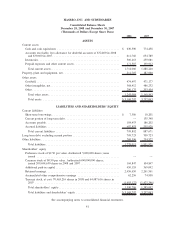
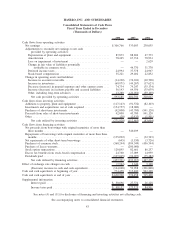
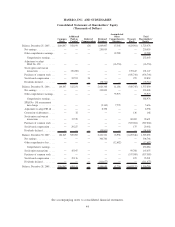
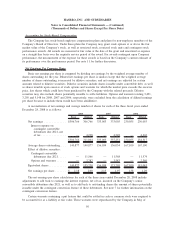
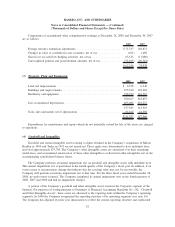
HASBRO, INC. AND SUBSIDIARIES
Consolidated Statements of Operations
Fiscal Years Ended in December
(Thousands of Dollars Except Per Share Data)
2008 2007 2006
Net revenues ........................................... $4,021,520 3,837,557 3,151,481
Cost of sales ........................................... 1,692,728 1,576,621 1,303,885
Gross profit....................................... 2,328,792 2,260,936 1,847,596
Expenses
Amortization ......................................... 78,265 67,716 78,934
Royalties ............................................ 312,986 316,807 169,731
Research and product development ......................... 191,424 167,194 171,358
Advertising .......................................... 454,612 434,742 368,996
Selling, distribution and administration ...................... 797,209 755,127 682,214
Total expenses ...................................... 1,834,496 1,741,586 1,471,233
Operating profit ................................... 494,296 519,350 376,363
Nonoperating (income) expense
Interest expense ....................................... 47,143 34,618 27,521
Interest income ........................................ (17,654) (29,973) (27,609)
Other (income) expense, net .............................. 23,752 52,323 34,977
Total nonoperating expense, net .......................... 53,241 56,968 34,889
Earnings before income taxes ......................... 441,055 462,382 341,474
Income taxes ........................................... 134,289 129,379 111,419
Net earnings ...................................... $ 306,766 333,003 230,055
Per common share
Net earnings
Basic ............................................. $ 2.18 2.13 1.38
Diluted ............................................ $ 2.00 1.97 1.29
Cash dividends declared ................................. $ 0.80 0.64 0.48
See accompanying notes to consolidated financial statements.
42