Chevron 2010 Annual Report Download - page 8
Download and view the complete annual report
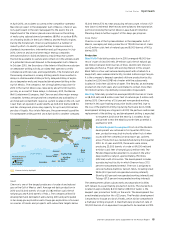
Please find page 8 of the 2010 Chevron annual report below. You can navigate through the pages in the report by either clicking on the pages listed below, or by using the keyword search tool below to find specific information within the annual report.-
 1
1 -
 2
2 -
 3
3 -
 4
4 -
 5
5 -
 6
6 -
 7
7 -
 8
8 -
 9
9 -
 10
10 -
 11
11 -
 12
12 -
 13
13 -
 14
14 -
 15
15 -
 16
16 -
 17
17 -
 18
18 -
 19
19 -
20
-
21
-
22
-
23
-
24
-
25
-
26
-
27
-
28
-
29
-
30
-
31
-
32
-
33
-
34
-
35
-
36
-
37
-
38
-
39
-
40
-
41
-
42
-
43
-
44
-
45
-
46
-
47
-
48
-
49
-
50
-
51
-
52
-
53
-
54
-
55
-
56
-
57
-
58
-
59
-
60
-
61
-
62
-
63
-
64
-
65
-
66
-
67
-
68
 |
 |
Financial Information
6 Chevron Corporation 2010 Supplement to the Annual Report
0.0
27.0
36.0
18.0
9.0
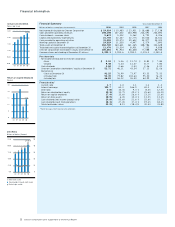
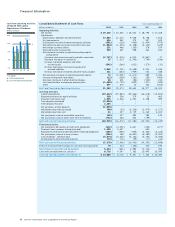
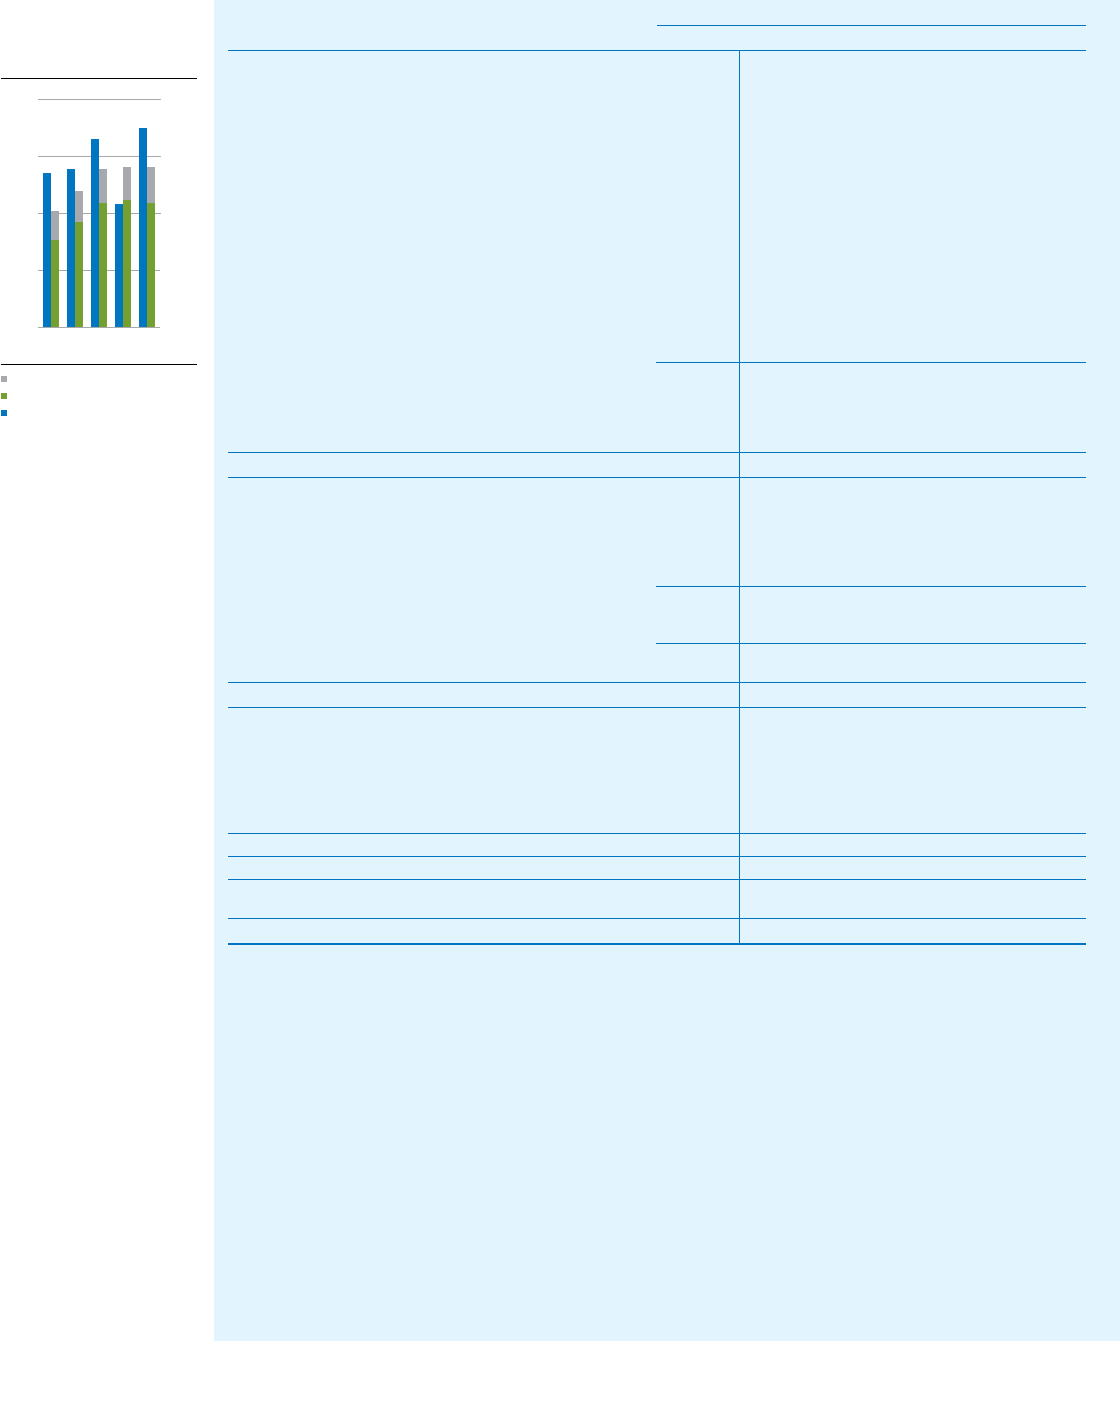
Cash From Operating Activities
Compared With Capital
Expenditures & Dividends
Billions of dollars
Dividends
Capital Expenditures
Cash From Operating Activities
0706 08 09 10
$31.4
$25.4
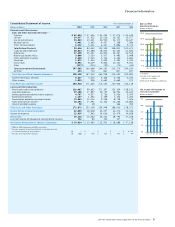
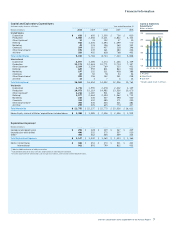
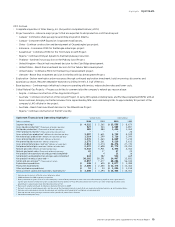
Consolidated Statement of Cash Flows Year ended December 31
Millions of dollars 2010 2009 2008 2007 2006
Operating Activities
Net income $ 19,136 $ 10,563 $ 24,031 $ 18,795 $ 17,208
Adjustments
Depreciation, depletion and amortization 13,063 12,110 9,528 8,708 7,506
Dry hole expense 496 552 375 507 520
Distributions less than income from equity affiliates (501 ) (103 ) (440 ) (1,439 ) (979 )
Net before-tax gains on asset retirements and sales (1,004 ) (1,255 ) (1,358 ) (2,315 ) (229 )
Net foreign currency effects 251 466 (355 ) 378 259
Deferred income tax provision 559 467 598 261 614
Net decrease (increase) in operating working capital
composed of:
(Increase) decrease in accounts and notes receivable (2,767 ) (1,476 ) 6,030 (3,867 ) 17
Decrease (increase) in inventories 15 1,213 (1,545 ) (749 ) (536 )
Increase in prepaid expenses and other
current assets (542 ) (264 ) (621 ) (370 ) (31 )
Increase (decrease) in accounts payable and
accrued liabilities 3,049 (1,121 ) (4,628 ) 4,930 1,246
Increase (decrease) in income and other taxes payable 321 (653 ) (909 ) 741 348
Net decrease (increase) in operating working capital 76 (2,301 ) (1,673 ) 685 1,044
Increase in long-term receivables (12 ) (258 ) (161 ) (82 ) (900 )
Decrease (increase) in other deferred charges 48 201 (84 ) (530 ) 232
Cash contributions to employee pension plans (1,450 ) (1,739 ) (839 ) (317 ) (449 )
Other
697 670 10 326 (503 )
Net Cash Provided by Operating Activities 31,359 19,373 29,632 24,977 24,323
Investing Activities
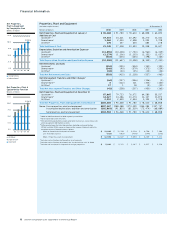
Capital expenditures (19,612 ) (19,843 ) (19,666 ) (16,678 ) (13,813 )
Repayment of loans by equity affiliates 338 336 179 21 463
Proceeds from asset sales 1,995 2,564 1,491 3,338 989
Time deposits purchased (5,060 ) – – – –
Time deposits matured 2,205 – – – –
Net purchases of time deposits (2,855 ) – – – –
Marketable securities purchased (90 ) (30 ) (3,236 ) (1,975 ) (1,271 )
Marketable securities sold 41 157 3,719 2,160 1,413
Net (purchases) sales of marketable securities (49 ) 127 483 185 142
Net (purchases) sales of other short-term investments (732 ) 244 432 (799 ) –
Net Cash Used for Investing Activities (20,915 ) (16,572 ) (17,081 ) (13,933 ) (12,219 )
Financing Activities
Net (payments) borrowings of short-term obligations (212 ) (3,192 ) 2,647 (345 ) (677 )
Proceeds from issuances of long-term debt 1,250 5,347 – 650 –
Repayments of long-term debt and other financing obligations (156 ) (496 ) (965 ) (3,343 ) (2,224 )
Net (purchases) sales of treasury shares (306 ) 168 (6,821 ) (6,389 ) (4,491 )
Cash dividends – common stock (5,674 ) (5,302 ) (5,162 ) (4,791 ) (4,396 )
Distributions to noncontrolling interests (72 ) (71 ) (99 ) (77 ) (60 )
Net Cash Used for Financing Activities (5,170 ) (3,546 ) (10,400 ) (14,295 ) (11,848 )
Effect of Exchange Rate Changes on Cash and Cash Equivalents 70 114 (166 ) 120 194
Net Change in Cash and Cash Equivalents 5,344 (631 ) 1,985 (3,131 ) 450
Cash and cash equivalents at January 1 8,716 9,347 7,362 10,493 10,043
Cash and Cash Equivalents at December 31 $ 14,060 $ 8,716 $ 9,347 $ 7,362 $ 10,493