Chevron 2010 Annual Report Download - page 46
Download and view the complete annual report
Please find page 46 of the 2010 Chevron annual report below. You can navigate through the pages in the report by either clicking on the pages listed below, or by using the keyword search tool below to find specific information within the annual report.-
 1
1 -
2
-
3
-
4
-
5
-
6
-
7
-
8
-
9
-
10
-
11
-
12
-
13
-
14
-
15
-
16
-
17
-
18
-
19
-
20
-
21
-
22
-
23
-
24
-
25
-
26
-
27
-
28
-
29
-
30
-
31
-
32
-
33
-
34
-
35
-
 36
36 -
 37
37 -
 38
38 -
 39
39 -
 40
40 -
 41
41 -
 42
42 -
 43
43 -
 44
44 -
 45
45 -
 46
46 -
 47
47 -
 48
48 -
 49
49 -
 50
50 -
 51
51 -
 52
52 -
 53
53 -
 54
54 -
 55
55 -
 56
56 -
57
-
58
-
59
-
60
-
61
-
62
-
63
-
64
-
65
-
66
-
67
-
68
 |
 |

44 Chevron Corporation 2010 Supplement to the Annual Report
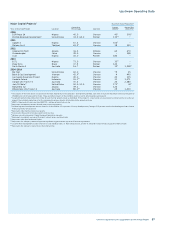
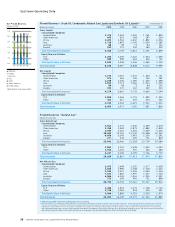
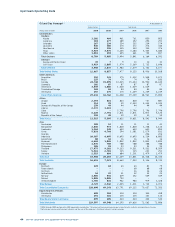
Upstream Operating Data
Oil and Gas Acreage1,2 At December 31
Gross Acres Net Acres
Thousands of acres 2010 2010 2009 2008 2007 2006
United States
Onshore
Alaska 1,182 464 461 761 850 805
California 303 277 289 292 294 291
Colorado 267 234 224 232 234 274
Louisiana 436 386 275 272 274 344
New Mexico 536 355 335 343 354 376
Texas 4,924 3,575 3,265 3,280 3,405 3,684
Other states 1,061 694 645 661 753 817
Total Onshore 8,709 5,985 5,494 5,841 6,164 6,591
Offshore
Alaska and Pacific Coast 39 7 9 10 10 31
Gulf Coast 3,919 2,865 1,974 2,369 2,732 3,646
Total Offshore 3,958 2,872 1,983 2,379 2,742 3,677
Total United States 12,667 8,857 7,477 8,220 8,906 10,268
Other Americas
Argentina 152 141 275 1,402 1,548 1,671
Brazil 225 74 74 74 74 180
Canada 24,748 15,095 14,525 15,244 14,900 14,633
Colombia 202 87 87 87 87 87
Greenland 3,449 1,006 1,028 1,029 1,029 –
Trinidad and Tobago 168 84 84 84 84 84
Venezuela 292 275 275 1,239 1,239 1,239
Total Other Americas 29,236 16,762 16,348 19,159 18,961 17,894
Africa
Angola 2,393 821 823 828 737 887
Chad 114 29 39 2,043 2,043 2,043
Democratic Republic of the Congo 250 44 44 44 44 44
Liberia 2,372 1,661 – – – –
L i b y a – – 2,796 2,796 2,796 2,796
Nigeria 6,228 2,791 2,871 2,871 2,871 3,120
Republic of the Congo 158 49 49 49 50 59
Total Africa 11,515 5,395 6,622 8,631 8,541 8,949
Asia
Azerbaijan 108 12 11 11 11 41
Bangladesh 2,036 973 1,828 1,828 1,258 2,115
Cambodia 1,164 349 640 640 640 853
China 5,833 4,766 294 1,081 1,079 812
Georgia – – – – 206 206
Indonesia 10,387 6,695 6,695 6,695 6,234 6,885
Kazakhstan 80 16 16 16 16 16
Myanmar 6,460 1,826 1,832 1,832 1,832 1,832
Partitioned Zone 1,576 788 788 788 788 788
Philippines 205 93 93 93 93 93
Thailand 17,975 9,281 9,233 9,531 9,531 8,059
Turkey 5,561 2,781 125 125 251 251
Vietnam 2,515 684 684 1,201 1,479 1,479
Total Asia 53,900 28,264 22,239 23,841 23,418 23,430
Total Australia 16,651 7,323 8,660 7,950 9,106 8,740
Europe
Denmark 420 63 63 63 81 79
Faroe Islands – – – 68 68 68
Germany – – – 26 26 26
Netherlands 54 22 21 22 22 22
Norway 1,405 541 609 252 549 549
Poland 1,085 1,085 790 – – –
United Kingdom 1,765 831 962 980 979 1,328
Total Europe 4,729 2,542 2,445 1,411 1,725 2,072
Total Consolidated Companies 128,698 69,143 63,791 69,212 70,657 71,353
Equity Share in Affiliates
Kazakhstan 608 304 304 304 304 418
Venezuela 291 101 100 100 101 115
Total Equity Share in Affiliates 899 405 404 404 405 533
Total Worldwide 129,597 69,548 64,195 69,616 71,062 71,886
1 2006 through 2009 conformed to 2010 geographic presentation. Table does not include mining acreage associated with synthetic oil production in Canada.
2 Net acreage includes wholly owned interests and the sum of the company’s fractional interests in gross acreage.