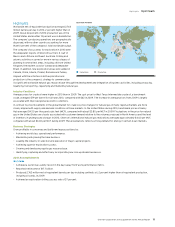
Chevron 2010 Annual Report Download - page 10
Download and view the complete annual report
Please find page 10 of the 2010 Chevron annual report below. You can navigate through the pages in the report by either clicking on the pages listed below, or by using the keyword search tool below to find specific information within the annual report.-
 1
1 -
 2
2 -
 3
3 -
 4
4 -
 5
5 -
 6
6 -
 7
7 -
 8
8 -
 9
9 -
 10
10 -
 11
11 -
 12
12 -
 13
13 -
 14
14 -
 15
15 -
 16
16 -
 17
17 -
 18
18 -
 19
19 -
 20
20 -
 21
21 -
22
-
23
-
24
-
25
-
26
-
27
-
28
-
29
-
30
-
31
-
32
-
33
-
34
-
35
-
36
-
37
-
38
-
39
-
40
-
41
-
42
-
43
-
44
-
45
-
46
-
47
-
48
-
49
-
50
-
51
-
52
-
53
-
54
-
55
-
56
-
57
-
58
-
59
-
60
-
61
-
62
-
63
-
64
-
65
-
66
-
67
-
68
 |
 |
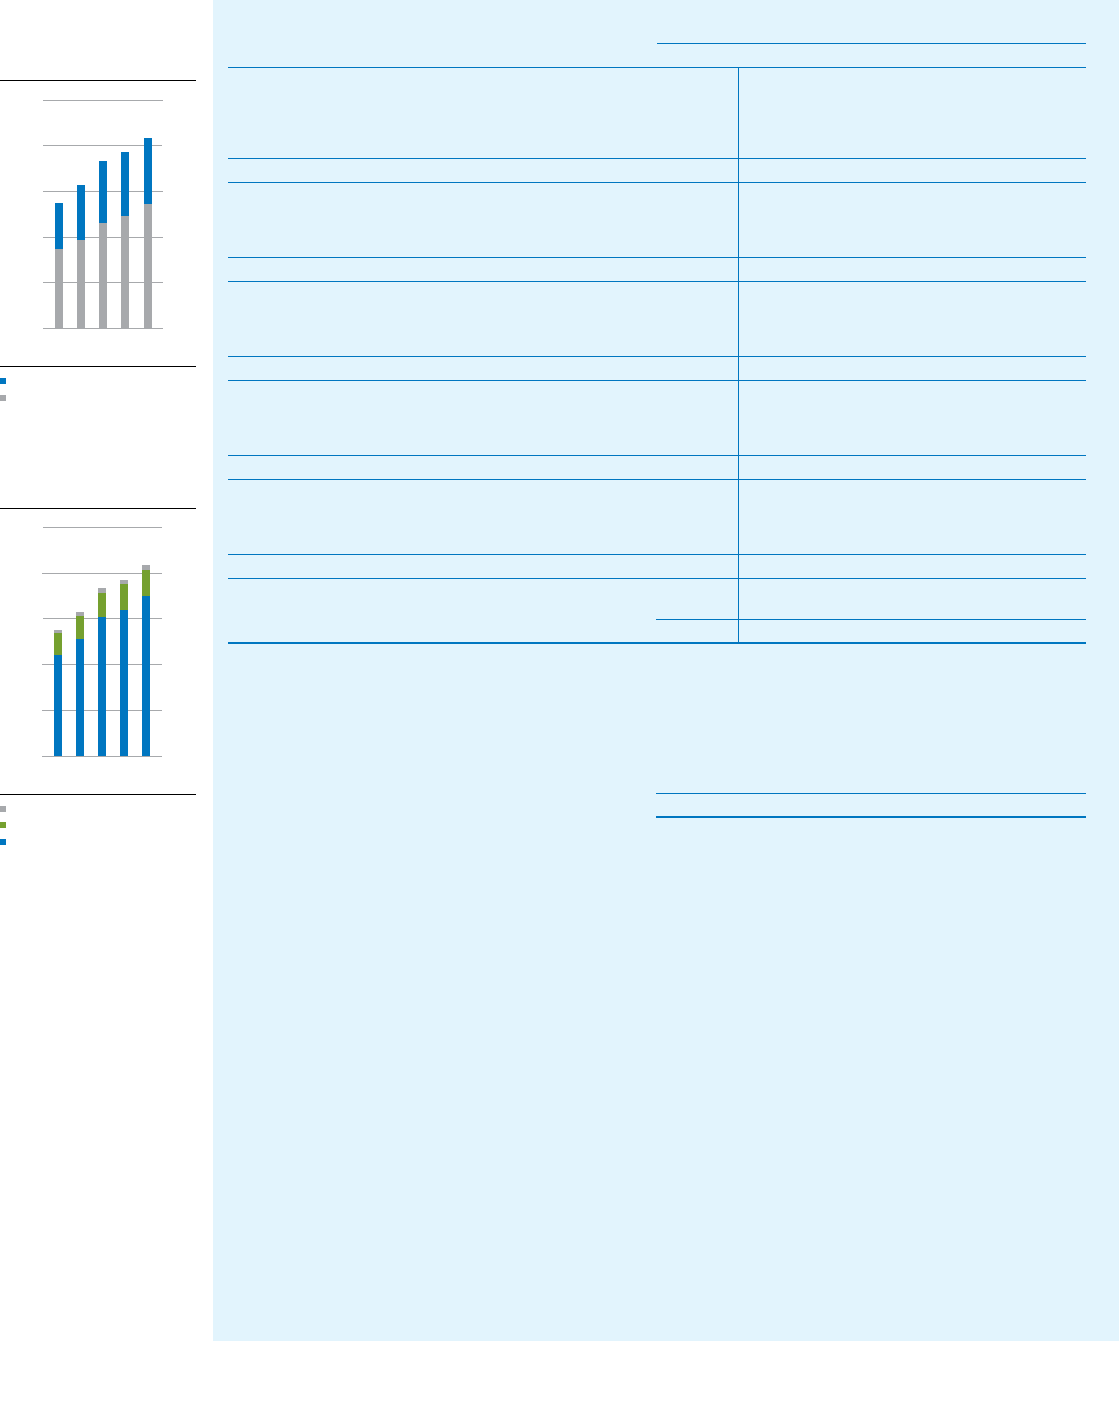
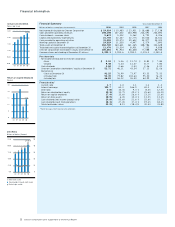
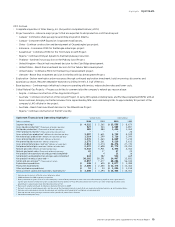
Financial Information
8 Chevron Corporation 2010 Supplement to the Annual Report
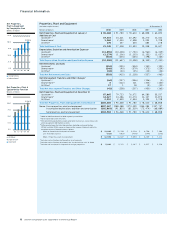
0.0
25.0
50.0
75.0
125.0
100.0
Net Properties,
Plant & Equipment
by Geographic Area
Billions of dollars
0706 08 09 10
$104.5
United States
International
Net Properties, Plant &
Equipment by Function
Billions of dollars
All Other
Downstream
Upstream
0.0
25.0
50.0
75.0
125.0
100.0
0706 08 09 10
$104.5
Properties, Plant and Equipment
(Includes capital leases) At December 31
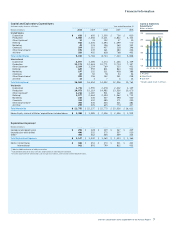
Millions of dollars 2010 2009 2008 2007 2006
Net Properties, Plant and Equipment at January 1 $ 96,468 $ 91,780 $ 78,610 $ 68,858 $ 63,690
Additions at Cost
Upstream1,2 19,315 14,321 20,392 16,270 11,041
Downstream1 1,560 2,330 2,598 2,093 1,708
All Other3 270 357 603 685 278
Total Additions at Cost 21,145 17,008 23,593 19,048 13,027
Depreciation, Depletion and Amortization Expense4
Upstream1 (11,055 ) (10,238 ) (7,750 ) (6,960 ) (6,029 )
Downstream1 (1,179 ) (1,106 ) (1,103 ) (1,151 ) (1,037 )
All Other3 (316 ) (303 ) (245 ) (198 ) (165 )
Total Depreciation, Depletion and Amortization Expense (12,550 ) (11,647 ) (9,098 ) (8,309 ) (7,231 )
Net Retirements and Sales
Upstream1 (254 ) (295 ) (504 ) (151 ) (192 )
Downstream1 (246 ) (90 ) (579 ) (373 ) (239 )
All Other3 (18 ) (30 ) (35 ) (13 ) (34 )
Total Net Retirements and Sales (518 ) (415 ) (1,118 ) (537 ) (465 )
Net Intersegment Transfers and Other Changes5
Upstream1,6 (64 ) (137 ) (346 ) (136 ) (2 )
Downstream1,6 6 (122 ) 121 (305 ) (140 )
All Other3 17 1 18 (9 ) (21 )
Total Net Intersegment Transfers and Other Changes (41 ) (258 ) (207 ) (450 ) (163 )
Net Properties, Plant and Equipment at December 31
Upstream1,7 87,665 79,723 76,072 64,280 55,257
Downstream1 14,327 14,186 13,174 12,137 11,873
All Other3 2,512 2,559 2,534 2,193 1,728
Total Net Properties, Plant and Equipment at December 31 $ 104,504 $ 96,468 $ 91,780 $ 78,610 $ 68,858
Memo: Gross properties, plant and equipment $ 207,367 $ 188,288 $ 173,299 $ 154,084 $ 137,747
Accumulated depreciation, depletion and amortization (102,863 ) (91,820 ) (81,519 ) (75,474 ) (68,889 )
Net properties, plant and equipment $ 104,504 $ 96,468 $ 91,780 $ 78,610 $ 68,858
1 2006 to 2009 conformed to 2010 segment presentation.
2 Net of exploratory well write-offs.
3 Primarily mining operations, power generation businesses, real estate assets
and management information systems.
4 Difference between the total depreciation, depletion and amortization
(DD&A) and total DD&A expense shown on the income statement relates to
accretion expense. Reconciliation as follows:
DD&A on consolidated statement of income $ 13,063 $ 12,110 $ 9,528 $ 8,708 $ 7,506
Less: Accretion expense (513 ) (463 ) (430 ) (399 ) (275 )
DD&A – Properties, plant and equipment $ 12,550 $ 11,647 $ 9,098 $ 8,309 $ 7,231
5 Includes reclassifications to/from other asset accounts.
6 Includes reclassification adjustments for “Assets held for sale” in 2008.
7 Includes net investment in unproved oil and gas properties: $ 5,081 $ 5,321 $ 5,367 $ 4,927 $ 5,218