Chevron 2010 Annual Report Download - page 15
Download and view the complete annual report
Please find page 15 of the 2010 Chevron annual report below. You can navigate through the pages in the report by either clicking on the pages listed below, or by using the keyword search tool below to find specific information within the annual report.-
 1
1 -
2
-
3
-
4
-
 5
5 -
 6
6 -
 7
7 -
 8
8 -
 9
9 -
 10
10 -
 11
11 -
 12
12 -
 13
13 -
 14
14 -
 15
15 -
 16
16 -
 17
17 -
 18
18 -
 19
19 -
 20
20 -
 21
21 -
 22
22 -
 23
23 -
 24
24 -
 25
25 -
26
-
27
-
28
-
29
-
30
-
31
-
32
-
33
-
34
-
35
-
36
-
37
-
38
-
39
-
40
-
41
-
42
-
43
-
44
-
45
-
46
-
47
-
48
-
49
-
50
-
51
-
52
-
53
-
54
-
55
-
56
-
57
-
58
-
59
-
60
-
61
-
62
-
63
-
64
-
65
-
66
-
67
-
68
 |
 |

Chevron Corporation 2010 Supplement to the Annual Report 13
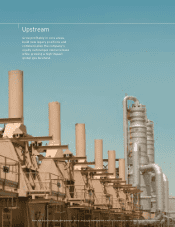
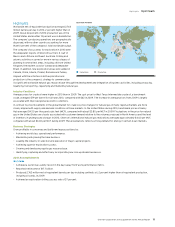
Highlights Upstream
2011 Outlook
• Complete acquisition of Atlas Energy, Inc. (Acquisition completed February 2011.)
• Project execution – Advance major projects that are expected to add production in 2011 and beyond:
— Canada – Commence shale gas appraisal drilling program in Alberta.
— Canada – Complete AOSP Expansion 1 Upgrader modifications.
— China – Continue construction and development at Chuandongbei gas project.
— Indonesia – Commence FEED for the Bangka natural gas project.
— Kazakhstan – Commence FEED for the TCO Future Growth Project.
— Nigeria – Continue drilling at Agbami to maintain plateau production.
— Thailand – Achieve first production on the Platong Gas II Project.
— United Kingdom – Reach final investment decision for the Clair Ridge development.
— United States – Reach final investment decision for the Tubular Bells development.
— United States – Commence FEED for the Mad Dog II development project.
— Vietnam – Reach final investment decision for the Block B Gas Development Project.
• Exploration – Deliver new hydrocarbon resources through continued exploration investment; build on previous discoveries and
appraisal successes. Resume deepwater exploratory drilling in the U.S. Gulf of Mexico.
• Base business – Continue major initiatives to improve operating efficiencies, reduce decline rates and lower costs.
• Global Natural Gas Projects – Progress activities to commercialize the company’s natural gas resource base:
— Angola – Continue construction of the Angola LNG Project.
— Australia – Continue construction of the Gorgon Project. In early 2011 signed a binding Sales and Purchase Agreement (SPA) with an
Asian customer, bringing contracted volumes from signed binding SPAs and nonbinding HOAs to approximately 90 percent of the
company’s LNG offtake for the project.
— Australia – Reach final investment decision for the Wheatstone Project.
— Nigeria – Continue construction of the EGTL facility.
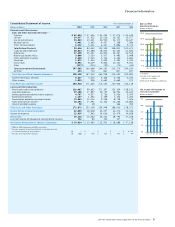
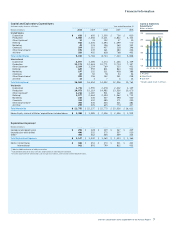
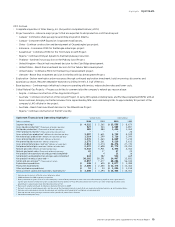
Upstream Financial and Operating Highlights1 United States International
Dollars in millions 2010 2009 2010 2009
Segment earnings2 $ 4,122 $ 2,262 $ 13,555 $ 8,670
Gross liquids production3 (Thousands of barrels per day) 527 523 1,989 1,857
Net liquids production3 (Thousands of barrels per day) 489 484 1,434 1,362
Other produced volumes4 (Thousands of barrels per day) – — – 26
Gross natural gas production3 (Millions of cubic feet per day) 1,507 1,611 4,732 4,519
Net natural gas production3 (Millions of cubic feet per day) 1,314 1,399 3,726 3,590
Gross proved liquids reserves3 (Millions of barrels) 1,376 1,463 6,869 7,234
Net proved liquids reserves3 (Millions of barrels) 1,275 1,361 5,228 5,612
Gross proved natural gas reserves3 (Billions of cubic feet) 2,813 3,074 26,476 27,741
Net proved natural gas reserves3 (Billions of cubic feet) 2,472 2,698 21,779 23,351
Natural gas sales (Millions of cubic feet per day) 5,932 5,901 4,493 4,062
Natural gas liquids sales (Thousands of barrels per day) 22 17 27 23
Net productive exploratory oil and gas wells completed5 1 4 11 16
Net productive development oil and gas wells completed5 634 582 522 669
Net productive wells at year-end5,6 38,182 38,391 14,907 12,831
Net oil and gas acreage7,8 (Thousands of acres) 8,857 7,477 60,286 56,314
Exploration expenditures $ 638 $ 605 $ 2,077 $ 1,385
Production expenditures $ 2,800 $ 2,656 $ 12,173 $ 12,463
Other upstream expenditures2 $ 12 $ 33 $ 1,204 $ 1,154
Total upstream capital and exploratory expenditures2 $ 3,450 $ 3,294 $ 15,454 $ 15,002
1 Includes equity share in affiliates unless otherwise noted.
2 2009 conformed to 2010 segment presentation.
3 Gross production or gross reserves are the company’s share of total production or total reserves before deducting royalties (and a government’s
agreed-upon share of production under a production-sharing contract [PSC]). Net production or net reserves are after deducting royalties (and a
government’s agreed-upon share of production under a PSC).
4 Represents volumes produced at Athabasca (Canada) Oil Sands in 2009.
5 Net wells include all wholly owned wells and the sum of the fractional interests in wells that are associated with joint ventures or unitized operations.
6 Includes wells producing or capable of producing and injection wells temporarily functioning as producing wells.
7 Does not include mining acreage associated with synthetic oil production in Canada.
8 Consolidated companies only.