Chevron 2010 Annual Report Download - page 40
Download and view the complete annual report
Please find page 40 of the 2010 Chevron annual report below. You can navigate through the pages in the report by either clicking on the pages listed below, or by using the keyword search tool below to find specific information within the annual report.-
 1
1 -
2
-
3
-
4
-
5
-
6
-
7
-
8
-
9
-
10
-
11
-
12
-
13
-
14
-
15
-
16
-
17
-
18
-
19
-
20
-
21
-
22
-
23
-
24
-
25
-
26
-
27
-
28
-
29
-
 30
30 -
 31
31 -
 32
32 -
 33
33 -
 34
34 -
 35
35 -
 36
36 -
 37
37 -
 38
38 -
 39
39 -
 40
40 -
 41
41 -
 42
42 -
 43
43 -
 44
44 -
 45
45 -
 46
46 -
 47
47 -
 48
48 -
 49
49 -
 50
50 -
51
-
52
-
53
-
54
-
55
-
56
-
57
-
58
-
59
-
60
-
61
-
62
-
63
-
64
-
65
-
66
-
67
-
68
 |
 |

38 Chevron Corporation 2010 Supplement to the Annual Report
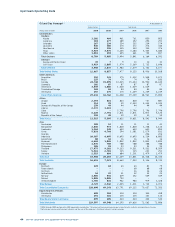
Upstream Operating Data
0.0
12.0
10.0
8.0
6.0
4.0
2.0
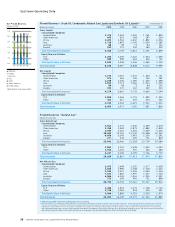
*BOE (barrels of oil-equivalent)
2010 and 2009 include reserves
for Canadian synthetic oil.
Net Proved Reserves
Billions of BOE*
Affiliates
Europe
Australia
Asia
Africa
Other Americas
United States
10.5
0706 08 09 10
Proved Reserves – Crude Oil, Condensate, Natural Gas Liquids and Synthetic Oil (Liquids)1,2 At December 31
Millions of barrels 2010 2009 2008 2007 2006
Gross Liquids
Consolidated Companies
United States 1,376 1,463 1,592 1,761 1,899
Other Americas 643 621 168 187 204
Africa 1,423 1,506 1,632 1,852 2,056
Asia 1,728 1,891 2,145 2,039 2,285
Australia 88 98 73 84 102
Europe 152 170 202 269 303
Total Consolidated Companies 5,410 5,749 5,812 6,192 6,849
Equity Share in Affiliates
TCO 2,255 2,359 2,420 2,454 2,449
Other 580 589 626 626 701
Total Equity Share in Affiliates 2,835 2,948 3,046 3,080 3,150
Total Worldwide 8,245 8,697 8,858 9,272 9,999
Net Liquids
Consolidated Companies
United States 1,275 1,361 1,470 1,624 1,751
Other Americas 574 564 149 165 181
Africa 1,168 1,246 1,385 1,500 1,698
Asia 1,013 1,171 1,456 1,023 1,259
Australia 88 98 73 84 102
Europe 152 170 202 269 303
Total Consolidated Companies 4,270 4,610 4,735 4,665 5,294
Equity Share in Affiliates
TCO 1,820 1,946 2,176 1,989 1,950
Other 413 417 439 433 562
Total Equity Share in Affiliates 2,233 2,363 2,615 2,422 2,512
Total Worldwide 6,503 6,973 7,350 7,087 7,806
Proved Reserves – Natural Gas1,2
Billions of cubic feet
Gross Natural Gas
Consolidated Companies
United States 2,813 3,074 3,630 4,249 4,678
Other Americas 2,358 2,589 2,879 2,882 2,828
Africa 2,944 3,022 3,056 3,049 3,206
Asia 10,594 11,191 11,102 10,698 10,132
Australia 6,056 6,245 1,961 2,105 2,391
Europe 277 345 490 721 849
Total Consolidated Companies 25,042 26,466 23,118 23,704 24,084
Equity Share in Affiliates
TCO 3,081 3,225 3,348 3,440 3,435
Other 1,166 1,124 947 326 284
Total Equity Share in Affiliates 4,247 4,349 4,295 3,766 3,719
Total Worldwide 29,289 30,815 27,413 27,470 27,803
Net Natural Gas
Consolidated Companies
United States 2,472 2,698 3,150 3,677 4,028
Other Americas 1,815 1,985 2,368 2,378 2,334
Africa 2,944 3,021 3,056 3,049 3,206
Asia 7,193 7,860 7,997 7,207 7,103
Australia 6,056 6,245 1,961 2,105 2,391
Europe 275 344 490 721 848
Total Consolidated Companies 20,755 22,153 19,022 19,137 19,910
Equity Share in Affiliates
TCO 2,386 2,833 3,175 2,748 2,743
Other 1,110 1,063 878 255 231
Total Equity Share in Affiliates 3,496 3,896 4,053 3,003 2,974
Total Worldwide 24,251 26,049 23,075 22,140 22,884
1 2006 through 2009 conformed to 2010 geographic presentation.
2 Proved reserves are estimated by the company’s asset teams, composed of earth scientists and reservoir engineers. These proved-reserve estimates are reviewed
annually by the company’s Reserves Advisory Committee to ensure that rigorous professional standards and the reserves definitions prescribed by the Securities
and Exchange Commission are consistently applied throughout the company. Refer to the Glossary for a definition of proved reserves. Net reserves exclude royalties
and interests owned by others and reflect contractual arrangements and royalty obligations in effect at the time of the estimate.