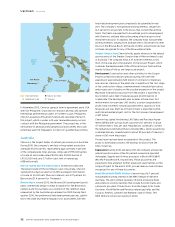
Chevron 2010 Annual Report Download - page 44
Download and view the complete annual report
Please find page 44 of the 2010 Chevron annual report below. You can navigate through the pages in the report by either clicking on the pages listed below, or by using the keyword search tool below to find specific information within the annual report.-
 1
1 -
2
-
3
-
4
-
5
-
6
-
7
-
8
-
9
-
10
-
11
-
12
-
13
-
14
-
15
-
16
-
17
-
18
-
19
-
20
-
21
-
22
-
23
-
24
-
25
-
26
-
27
-
28
-
29
-
30
-
31
-
32
-
33
-
 34
34 -
 35
35 -
 36
36 -
 37
37 -
 38
38 -
 39
39 -
 40
40 -
 41
41 -
 42
42 -
 43
43 -
 44
44 -
 45
45 -
 46
46 -
 47
47 -
 48
48 -
 49
49 -
 50
50 -
 51
51 -
 52
52 -
 53
53 -
 54
54 -
55
-
56
-
57
-
58
-
59
-
60
-
61
-
62
-
63
-
64
-
65
-
66
-
67
-
68
 |
 |

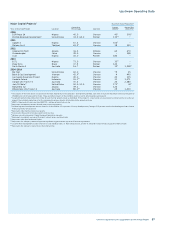
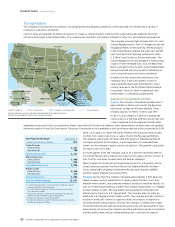
42 Chevron Corporation 2010 Supplement to the Annual Report
Upstream Operating Data
Gross Oil–Equivalent Production1 Year ended December 31
Thousands of barrels per day 2010 2009 2008 2007 2006
Consolidated Companies
United States 778 792 749 838 863
Other Americas 230 179 172 168 185
Africa 588 519 451 432 427
Asia 1,233 1,226 1,265 1,246 1,211
Australia 111 108 96 101 99
Europe 158 178 183 188 192
Total Consolidated Companies 3,098 3,002 2,916 2,973 2,977
Equity Share in Affiliates
TCO 374 321 243 203 196
Petropiar (Hamaca prior to 2008) 43 39 49 49 45
Petroboscan2 38 36 42 42 11
Petroindependiente2 3 4 5 5 1
Total Equity Share in Affiliates 458 400 339 299 253
Total Worldwide 3,556 3,402 3,255 3,272 3,230
Gross Liquids Production1
Thousands of barrels per day
Consolidated Companies
United States 527 523 459 507 510
Other Americas 129 77 80 82 96
Africa 562 500 415 408 413
Asia 779 792 813 838 852
Australia 34 35 33 39 39
Europe 101 114 118 129 126
Total Consolidated Companies 2,132 2,041 1,918 2,003 2,036
Equity Share in Affiliates
TCO 305 265 202 165 159
Petropiar (Hamaca prior to 2008) 40 38 46 47 43
Petroboscan2 38 35 41 41 11
Petroindependiente2 1 1 3 2 –
Total Equity Share in Affiliates 384 339 292 255 213
Total Worldwide 2,516 2,380 2,210 2,258 2,249
Gross Natural Gas Production1
Millions of cubic feet per day
Consolidated Companies
United States 1,507 1,611 1,740 1,983 2,115
Other Americas 605 614 555 518 535
Africa 155 116 213 145 88
Asia 2,723 2,605 2,709 2,439 2,152
Australia 458 435 376 373 359
Europe 346 382 391 358 395
Total Consolidated Companies 5,794 5,763 5,984 5,816 5,644
Equity Share in Affiliates
TCO 411 337 246 230 222
Petropiar (Hamaca prior to 2008) 15 11 14 13 11
Petroboscan2 6 6 5 6 1
Petroindependiente2 13 13 16 17 5
Total Equity Share in Affiliates 445 367 281 266 239
Total Worldwide 6,239 6,130 6,265 6,082 5,883
1 2006 through 2009 conformed to 2010 geographic presentation.
2 Joint stock company formed in October 2006.