Chevron 2010 Annual Report Download - page 59
Download and view the complete annual report
Please find page 59 of the 2010 Chevron annual report below. You can navigate through the pages in the report by either clicking on the pages listed below, or by using the keyword search tool below to find specific information within the annual report.
Chevron Corporation 2010 Supplement to the Annual Report 57
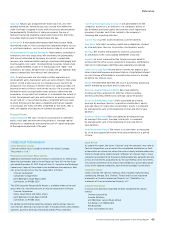
Downstream Operating Data
Marketing Retail Outlets
Number of outlets
Affiliate
Company
Retailer
0706 08 09 10
19,547
0
5000
10000
15000
20000
25000
30000
Marketing Retail Outlets1,2 At December 31
2010 2009 2008 2007 2006
Company Other Company Other Company Other Company Other Company Other
United States 495 7,756 502 9,089 507 9,178 548 9,183 578 9,050
Canada 159 2 161 – 160 1 162 2 162 2
E u r o p e 56 1,064 74 1,169 84 1,293 101 1,227 396 1,760
Latin America 496 863 541 841 977 2,442 1,040 2,510 1,134 2,575
Asia-Pacific 865 1,264 1,031 1,188 1,091 1,136 1,272 955 1,229 950
Africa-Pakistan 790 828 930 824 1,488 1,100 1,509 1,148 1,480 1,177
To tal 2,861 11,777 3,239 13,111 4,307 15,150 4,632 15,025 4,979 15,514
1 Excludes outlets of equity affiliates totaling 4,909, 5,224, 5,198, 5,095 and 5,033 for 2010, 2009, 2008, 2007 and 2006 respectively.
2 Company outlets are motor vehicle outlets that are company owned or leased. These outlets may be either company operated or leased to a dealer. Other outlets
consist of all remaining branded outlets that are owned by others and supplied with branded products.
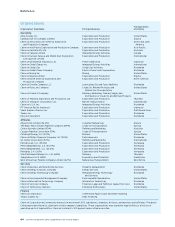
Vessels – Crude Oil and Refined Product Tankers by Type, Dead-Weight Tonnage1 At December 31
2010 2009 2008 2007 2006
U.S. Int’l. U.S. Int’l. U.S. Int’l. U.S. Int’l. U.S. Int’l.
Company-Owned and Bareboat-Chartered
25,000–65,000 5 – 5 – 5 – 4 – 3 –
65,000–120,000 – 6 – 6 – 6 – 6 – 5
120,000–160,000 – 4 – 4 – 4 – 5 – 5
160,000–320,000 – 5 – 6 – 6 – 6 – 6
Above 320,000 – 3 – 3 – 3 – 3 – 3
Total Company-Owned and Bareboat-Chartered 5 18 5 19 5 19 4 20 3 19
Time-Chartered2
25,000–65,000 – 6 – 7 – 10 – 16 – 14
65,000–120,000 – 6 – 8 – 7 – 8 – 8
160,000–320,000 – 2 – 2 – – – – – –
Total Time-Chartered – 14 – 17 – 17 – 24 – 22
Total Crude Oil and Refined Product Tankers 5 32 5 36 5 36 4 44 3 41
1 Consolidated companies only. Excludes tankers chartered on a voyage basis, those with dead-weight tonnage less than 25,000, and those used exclusively for storage.
2 Includes tankers chartered for more than one year.
Cargo Transported – Crude Oil and Refined Products* Year ended December 31
2010 2009 2008 2007 2006
U.S. Int’l. U.S. Int’l. U.S. Int’l. U.S. Int’l. U.S. Int’l.
Millions of barrels 29 301 42 307 32 255 36 278 25 297
Billions of ton-miles 8 332 7 358 5 328 6 333 3 344
* Consolidated companies only. Includes cargo carried by company-owned, bareboat-chartered and time-chartered vessels; excludes cargo carried by single-voyage
charters.


