Chevron 2010 Annual Report Download - page 7
Download and view the complete annual report
Please find page 7 of the 2010 Chevron annual report below. You can navigate through the pages in the report by either clicking on the pages listed below, or by using the keyword search tool below to find specific information within the annual report.-
 1
1 -
 2
2 -
 3
3 -
 4
4 -
 5
5 -
 6
6 -
 7
7 -
 8
8 -
 9
9 -
 10
10 -
 11
11 -
 12
12 -
 13
13 -
 14
14 -
 15
15 -
 16
16 -
 17
17 -
 18
18 -
19
-
20
-
21
-
22
-
23
-
24
-
25
-
26
-
27
-
28
-
29
-
30
-
31
-
32
-
33
-
34
-
35
-
36
-
37
-
38
-
39
-
40
-
41
-
42
-
43
-
44
-
45
-
46
-
47
-
48
-
49
-
50
-
51
-
52
-
53
-
54
-
55
-
56
-
57
-
58
-
59
-
60
-
61
-
62
-
63
-
64
-
65
-
66
-
67
-
68
 |
 |

Financial Information
Chevron Corporation 2010 Supplement to the Annual Report 5
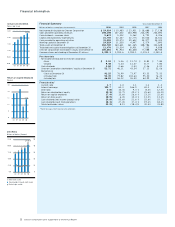
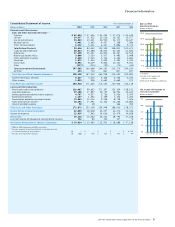
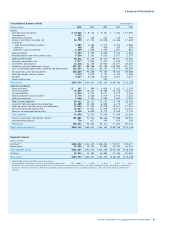
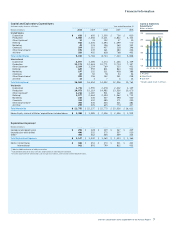
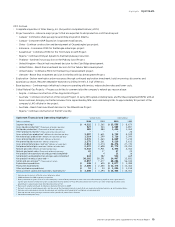
Consolidated Balance Sheet At December 31
Millions of dollars 2010 2009 2008 2007 2006
Assets
Cash and cash equivalents $ 14,060 $ 8,716 $ 9,347 $ 7,362 $ 10,493
Time deposits 2,855 – – – –
Marketable securities 155 106 213 732 953
Accounts and notes receivable, net 20,759 17,703 15,856 22,446 17,628
Inventories
Crude oil and petroleum products 3,589 3,680 5,175 4,003 3,586
Chemicals 395 383 459 290 258
Materials, supplies and other 1,509 1,466 1,220 1,017 812
Total inventories 5,493 5,529 6,854 5,310 4,656
Prepaid expenses and other current assets 5,519 5,162 4,200 3,527 2,574
Total Current Assets 48,841 37,216 36,470 39,377 36,304
Long-term receivables, net 2,077 2,282 2,413 2,194 2,203
Investments and advances 21,520 21,158 20,920 20,477 18,552
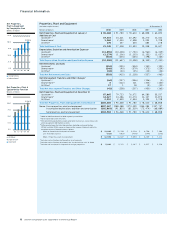
Properties, plant and equipment, at cost 207,367 188,288 173,299 154,084 137,747
Less: Accumulated depreciation, depletion and amortization 102,863 91,820 81,519 75,474 68,889
Net properties, plant and equipment 104,504 96,468 91,780 78,610 68,858
Deferred charges and other assets 3,210 2,879 4,711 3,491 2,088
Goodwill 4,617 4,618 4,619 4,637 4,623
Assets held for sale – – 252 – –
Total Assets $184,769 $164,621 $161,165 $148,786 $132,628
Liabilities and Equity
Short-term debt $ 187 $ 384 $ 2,818 $ 1,162 $ 2,159
Accounts payable 19,259 16,437 16,580 21,756 16,675
Accrued liabilities 5,324 5,375 8,077 5,275 4,546
Federal and other taxes on income 2,776 2,624 3,079 3,972 3,626
Other taxes payable 1,466 1,391 1,469 1,633 1,403
Total Current Liabilities 29,012 26,211 32,023 33,798 28,409
Long-term debt and capital lease obligations 11,289 10,130 6,083 6,070 7,679
Deferred credits and other noncurrent obligations 19,264 17,390 17,678 15,007 11,000
Noncurrent deferred income taxes 12,697 11,521 11,539 12,170 11,647
Reserves for employee benefit plans 6,696 6,808 6,725 4,449 4,749
Total Liabilities 78,958 72,060 74,048 71,494 63,484
Chevron Corporation stockholders’ equity 105,081 91,914 86,648 77,088 68,935
Noncontrolling interests 730 647 469 204 209
Total Equity 105,811 92,561 87,117 77,292 69,144
Total Liabilities and Equity $ 184,769 $164,621 $ 161,165 $ 148,786 $132,628
Segment Assets At December 31
Millions of dollars 2010 2009 2008 2007 2006
Upstream1,2 $120,242 $111,305 $108,440 $ 92,907 $ 80,677
Downstream1 41,965 39,935 37,842 42,533 36,291
Total Segment Assets $162,207 $ 151,240 $146,282 $135,440 $ 116,968
All Other2 22,562 13,381 14,883 13,346 15,660
Total Assets $184,769 $ 164,621 $161,165 $ 148,786 $ 132,628
1 2006 to 2009 conformed to 2010 segment presentation.
2 Includes goodwill associated with the acquisition of Unocal Corporation: $ 4,617 $ 4,618 $ 4,619 $ 4,637 $ 4,623
3 “All Other” assets consist primarily of worldwide cash, cash equivalents and marketable securities, real estate, information systems, the company’s investment in
Dynegy Inc. prior to its disposition in 2007, mining operations, power generation businesses, technology companies, and assets of the corporate administrative
functions.