Chevron 2010 Annual Report Download - page 47
Download and view the complete annual report
Please find page 47 of the 2010 Chevron annual report below. You can navigate through the pages in the report by either clicking on the pages listed below, or by using the keyword search tool below to find specific information within the annual report.-
 1
1 -
2
-
3
-
4
-
5
-
6
-
7
-
8
-
9
-
10
-
11
-
12
-
13
-
14
-
15
-
16
-
17
-
18
-
19
-
20
-
21
-
22
-
23
-
24
-
25
-
26
-
27
-
28
-
29
-
30
-
31
-
32
-
33
-
34
-
35
-
36
-
 37
37 -
 38
38 -
 39
39 -
 40
40 -
 41
41 -
 42
42 -
 43
43 -
 44
44 -
 45
45 -
 46
46 -
 47
47 -
 48
48 -
 49
49 -
 50
50 -
 51
51 -
 52
52 -
 53
53 -
 54
54 -
 55
55 -
 56
56 -
 57
57 -
58
-
59
-
60
-
61
-
62
-
63
-
64
-
65
-
66
-
67
-
68
 |
 |

Chevron Corporation 2010 Supplement to the Annual Report 45
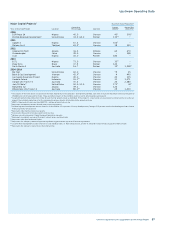
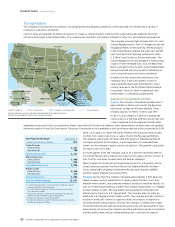
Upstream Operating Data
Net Productive Exploratory
Wells Completed
Number of wells
0706 08 09 10
12
Crude Oil
Natural Gas
0
15
30
45
60
75
Net Productive Development
Wells Completed
Number of wells
0706 08 09 10
1,156
Natural Gas
Crude Oil
0
450
900
1350
1800
Net Wells Completed1,2 Year ended December 31
2010 2009 2008 2007 2006
Productive Dry Productive Dry Productive Dry Productive Dry Productive Dry
Consolidated Companies
United States
Exploratory 1 1 4 5 8 2 4 8 16 8
Development 634 7 582 3 846 4 875 5 951 11
Total United States 635 8 586 8 854 6 879 13 967 19
Other Americas
Exploratory – 1 1 2 39 2 39 6 4 3
Development 32 – 36 – 35 – 44 – 34 –
Total Other Americas 32 1 37 2 74 2 83 6 38 3
Africa
Exploratory 1 – 2 1 2 1 6 2 1 –
Development 33 – 40 – 33 – 43 – 45 2
Total Africa 34 – 42 1 35 1 49 2 46 2
Asia
Exploratory 5 5 9 1 9 2 13 9 18 7
Development 445 15 580 10 665 1 597 – 493 1
Total Asia 450 20 589 11 674 3 610 9 511 8
Australia
Exploratory 5 2 4 2 4 – 2 – 3 –
Development – – – – – – – – – –
Total Australia 5 2 4 2 4 – 2 – 3 –
Europe
Exploratory – – – – 1 – 2 – 1 –
Development 4 – 7 – 6 – 8 – 9 –
Total Europe 4 – 7 – 7 – 10 – 10 –
Total Consolidated Companies 1,160 31 1,265 24 1,648 12 1,633 30 1,575 32
Equity Share in Affiliates
Exploratory – – – – – – – – 1 –
Development 8 – 6 – 16 – 3 – 13 –
Total Equity Share in Affiliates 8 – 6 – 16 – 3 – 14 –
Total Worldwide 1,168 31 1,271 24 1,664 12 1,636 30 1,589 32
1 2006 through 2009 conformed to 2010 geographic presentation.
2 Net Wells Completed includes wholly owned wells and the sum of the company’s fractional interests in jointly owned wells completed during the year, regardless of
when drilling was initiated. Completion refers to the installation of permanent equipment for the production of crude oil or natural gas or, in the case of a dry well,
the reporting of abandonment to the appropriate agency. Some exploratory wells are not drilled with the intention of producing from the well bore. In such cases,
“completion” refers to the completion of drilling. Further categorization of productive or dry is based on the determination as to whether hydrocarbons in a suffi-
cient quantity were found to justify completion as a producing well, whether or not the well is actually going to be completed as a producer.
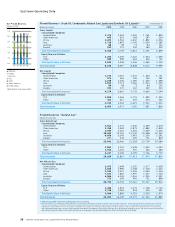
Net Productive Wells1,2 At December 31
2010 2009 2008 2007 2006
Consolidated Companies
United States
Oil 32,462 32,720 33,595 33,217 33,067
Gas 5,720 5,671 5,569 6,043 6,212
Total United States 38,182 38,391 39,164 39,260 39,279
International
Oil 12,501 10,835 10,290 10,538 9,903
Gas 2,000 1,591 1,837 1,730 1,513
Total International 14,501 12,426 12,127 12,268 11,416
Total Consolidated Companies 52,683 50,817 51,291 51,528 50,695
Equity Share in Affiliates
Oil 404 403 413 375 375
Gas 2 2 2 – –
Total Equity Share in Affiliates 406 405 415 375 375
Total Worldwide 53,089 51,222 51,706 51,903 51,070
1 Net Productive Wells includes wholly owned wells and the sum of the company’s fractional interests in wells completed in jointly owned operations.
2 Includes wells producing or capable of producing and injection wells temporarily functioning as producing wells. Wells that produce both crude oil and natural gas
are classified as oil wells.