Chevron 2010 Annual Report Download - page 58
Download and view the complete annual report
Please find page 58 of the 2010 Chevron annual report below. You can navigate through the pages in the report by either clicking on the pages listed below, or by using the keyword search tool below to find specific information within the annual report.-
 1
1 -
2
-
3
-
4
-
5
-
6
-
7
-
8
-
9
-
10
-
11
-
12
-
13
-
14
-
15
-
16
-
17
-
18
-
19
-
20
-
21
-
22
-
23
-
24
-
25
-
26
-
27
-
28
-
29
-
30
-
31
-
32
-
33
-
34
-
35
-
36
-
37
-
38
-
39
-
40
-
41
-
42
-
43
-
44
-
45
-
46
-
47
-
 48
48 -
 49
49 -
 50
50 -
 51
51 -
 52
52 -
 53
53 -
 54
54 -
 55
55 -
 56
56 -
 57
57 -
 58
58 -
 59
59 -
 60
60 -
 61
61 -
 62
62 -
 63
63 -
 64
64 -
 65
65 -
 66
66 -
 67
67 -
 68
68
 |
 |
56 Chevron Corporation 2010 Supplement to the Annual Report
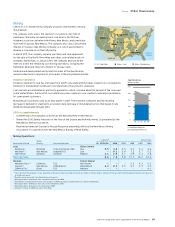
Downstream Operating Data
Refined Product Sales Year ended December 31
Thousands of barrels per day 2010 2009 2008 2007 2006
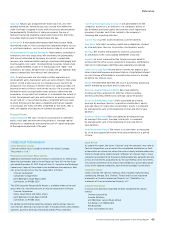
United States
Gasoline 700 720 692 728 712
Gas oil and kerosene 232 226 229 221 252
Jet fuel 223 254 274 271 280
Residual fuel oil 99 110 127 138 128
Other petroleum products 95 93 91 99 122
Total United States 1,349 1,403 1,413 1,457 1,494
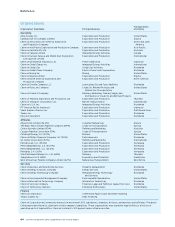
International1
Gasoline 521 555 589 581 595
Gas oil and kerosene 583 647 710 730 776
Jet fuel 271 264 278 274 266
Residual fuel oil 197 209 257 271 324
Other petroleum products 192 176 182 171 166
Total International 1,764 1,851 2,016 2,027 2,127
Worldwide2
Gasoline 1,221 1,275 1,281 1,309 1,307
Gas oil and kerosene 815 873 939 951 1,028
Jet fuel 494 518 552 545 546
Residual fuel oil 296 319 384 409 452
Other petroleum products 287 269 273 270 288
Total Worldwide 3,113 3,254 3,429 3,484 3,621
1 Includes share of equity affiliates’ sales: 562 516 512 492 492
2 Includes amounts for buy/sell contracts: – – – – 50
Light Product Sales1,2 Year ended December 31
2010 2009 2008 2007 2006
Sales Revenues (Millions of dollars)
United States $ 39,501 $ 32,885 $ 51,279 $ 41,561 $ 38,474
International 43,252 39,674 65,686 53,904 51,195
Total Sales Revenues $ 82,753 $ 72,559 $ 116,965 $ 95,465 $ 89,669
Sales Volumes (Thousands of barrels per day)
United States 1,155 1,200 1,195 1,220 1,244
International 1,005 1,129 1,256 1,278 1,329
Total Sales Volumes 2,160 2,329 2,451 2,498 2,573
1 Consolidated companies only and includes amounts for buy/sell contracts prior to second quarter 2006.
2 Light-product sales include motor gasoline, jet fuel, gas oils and kerosene.
Natural Gas Liquids Sales
(Includes equity share in affiliates) Year ended December 31
Thousands of barrels per day 2010 2009 2008 2007 2006
United States 139 144 144 135 72
International 78 88 97 96 81
Total 217 232 241 231 153
U.S. Refined Product Sales
Thousands of barrels per day
1,349
0706 08 09 10
Other
Residual Fuel Oil
Gas Oil & Kerosene
Jet Fuel
Gasoline
0
400
800
1200
1600
0706 08 09 10
1,76 4
International Refined Product
Sales*
Thousands of barrels per day
*Includes equity in affiliates.
Other
Residual Fuel Oil
Gas Oil & Kerosene
Jet Fuel
Gasoline
0
450
900
1350
1800
2250