Chevron 2010 Annual Report Download - page 5
Download and view the complete annual report
Please find page 5 of the 2010 Chevron annual report below. You can navigate through the pages in the report by either clicking on the pages listed below, or by using the keyword search tool below to find specific information within the annual report.-
 1
1 -
 2
2 -
 3
3 -
 4
4 -
 5
5 -
 6
6 -
 7
7 -
 8
8 -
 9
9 -
 10
10 -
 11
11 -
 12
12 -
 13
13 -
 14
14 -
 15
15 -
 16
16 -
17
-
18
-
19
-
20
-
21
-
22
-
23
-
24
-
25
-
26
-
27
-
28
-
29
-
30
-
31
-
32
-
33
-
34
-
35
-
36
-
37
-
38
-
39
-
40
-
41
-
42
-
43
-
44
-
45
-
46
-
47
-
48
-
49
-
50
-
51
-
52
-
53
-
54
-
55
-
56
-
57
-
58
-
59
-
60
-
61
-
62
-
63
-
64
-
65
-
66
-
67
-
68
 |
 |

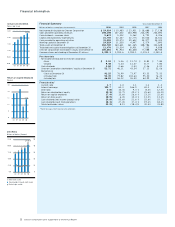
Financial Information
Chevron Corporation 2010 Supplement to the Annual Report 3
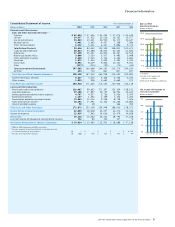
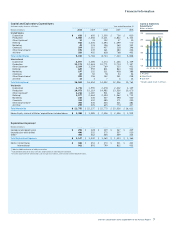
Sales & Other
Operating Revenues
Billions of dollars
0706 08 09 10
$198.2
All Other
Crude Oil & Condensate,
Natural Gas, & NGLs
Petroleum Products & Chemicals
0.0
50.0
100.0
150.0
200.0
250.0
300.0
0.0
25.0
20.0
15.0
5.0
10.0
Net Income Attributable to
Chevron Corporation
Billions of dollars
06 08 09 10
$19.0
07
Consolidated Statement of Income Year ended December 31
Millions of dollars 2010 2009 2008 2007 2006
Revenues and Other Income
Sales and Other Operating Revenues1,2
Gasoline $ 42,553 $ 37,336 $ 53,254 $ 47,074 $ 42,639
Jet fuel 14,337 11,912 23,056 16,333 15,577
Gas oil and kerosene 25,863 23,311 40,940 32,170 31,647
Residual fuel oil 6,461 5,642 9,937 7,348 7,086
Other refined products 6,232 5,241 6,407 5,886 5,723
Total Refined Products 95,446 83,442 133,594 108,811 102,672
Crude oil and condensate 68,014 53,488 78,600 61,542 61,842
Natural gas 17,290 15,007 31,814 24,437 22,515
Natural gas liquids (NGLs) 3,868 3,130 5,517 4,483 3,488
Other petroleum revenues 2,660 2,123 3,116 2,460 2,862
Chemicals 1,813 1,502 1,694 1,493 1,330
Excise taxes 8,591 8,109 9,846 10,121 9,551
Other (117 ) (103 ) (90 ) (73 ) (65 )
Total Upstream and Downstream 197,565 166,698 264,091 213,274 204,195
All Other 633 704 867 817 697
Total Sales and Other Operating Revenues 198,198 167,402 264,958 214,091 204,892
Income from equity affiliates 5,637 3,316 5,366 4,144 4,255
Other income 1,093 918 2,681 2,669 971
Total Revenues and Other Income 204,928 171,636 273,005 220,904 210,118
Costs and Other Deductions
Purchased crude oil and products2 116,467 99,653 171,397 133,309 128,151
Operating expenses 19,188 17,857 20,795 16,932 14,624
Selling, general and administrative expenses 4,767 4,527 5,756 5,926 5,093
Exploration expenses 1,147 1,342 1,169 1,323 1,364
Depreciation, depletion and amortization3 13,063 12,110 9,528 8,708 7,506
Taxes other than on income1 18,191 17,591 21,303 22,266 20,883
Interest and debt expense 50 28 – 166 451
Total Costs and Other Deductions 172,873 153,108 229,948 188,630 178,072
Income Before Income Tax Expense 32,055 18,528 43,057 32,274 32,046
Income tax expense 12,919 7,965 19,026 13,479 14,838
Net Income 19,136 10,563 24,031 18,795 17,208
Less: Net income attributable to noncontrolling interests 112 80 100 107 70
Net Income Attributable to Chevron Corporation $ 19,024 $ 10,483 $ 23,931 $ 18,688 $ 17,138
1 2006 to 2009 conformed to 2010 presentation.
2 Includes amounts for buy/sell contracts; associated costs are
in “Purchased crude oil and products”: $ – $ – $ – $ – $ 6,725
3 Includes asset impairment charges: $ 121 $ 542 $ 351 $ 415 $ 44