Chevron 2010 Annual Report Download - page 49
Download and view the complete annual report
Please find page 49 of the 2010 Chevron annual report below. You can navigate through the pages in the report by either clicking on the pages listed below, or by using the keyword search tool below to find specific information within the annual report.-
 1
1 -
2
-
3
-
4
-
5
-
6
-
7
-
8
-
9
-
10
-
11
-
12
-
13
-
14
-
15
-
16
-
17
-
18
-
19
-
20
-
21
-
22
-
23
-
24
-
25
-
26
-
27
-
28
-
29
-
30
-
31
-
32
-
33
-
34
-
35
-
36
-
37
-
38
-
 39
39 -
 40
40 -
 41
41 -
 42
42 -
 43
43 -
 44
44 -
 45
45 -
 46
46 -
 47
47 -
 48
48 -
 49
49 -
 50
50 -
 51
51 -
 52
52 -
 53
53 -
 54
54 -
 55
55 -
 56
56 -
 57
57 -
 58
58 -
 59
59 -
60
-
61
-
62
-
63
-
64
-
65
-
66
-
67
-
68
 |
 |

Chevron Corporation 2010 Supplement to the Annual Report 47
Highlights Downstream
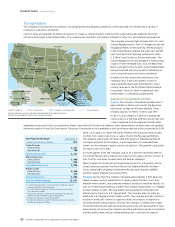
Fuel Refinery Major Chemical Manufacturing Facility
Downstream Overview
Highlights
The company enjoys a strong presence in all aspects of the down-
stream industry — refining, marketing, chemicals and transportation.
Industry Conditions
Earnings in refining and marketing in 2010 improved from historic
lows in 2009 due to recovering global demand, but remained
relatively weak with continued economic softness, excess refined
product supplies and surplus refining capacity. Worldwide demand
for motor gasoline, jet fuel, naphtha and distillates grew by approx-
imately 3.2 percent in 2010 from depressed levels in the prior year.
Despite some capacity coming offline, global refining capacity
increased by 1 million barrels per day, according to the December
2010 Oil & Gas Journal survey. Overall, these factors contributed to
a modest recovery in refining margins during 2010 from very weak
levels in 2009. Worldwide marketing margins remained narrow in
2010, but were above 2009 levels.
Chemicals experienced improved business conditions driven by a rebound in product demand. Globally, demand recovered in electrical
and electronic applications, transportation, and consumer packaging, which bolstered sales and margins.
Business Strategies
Improve returns and grow earnings across the value chain by:
• Achieving world-class safety and reliability performance.
• Continuing to improve execution of the base business.
• Driving earnings across the crude-to-customer value chain.
• Adding value to upstream operations through integration, technology and organizational capability.
2010 Accomplishments
• Achieved the lowest-ever total number of recordable safety incidents.
• Reported net income of $2.5 billion, including strong financial performance in the lubricants and chemicals businesses.
• Commissioned a new 60,000-barrel-per-day heavy-oil hydrocracker at the Yeosu Refinery in South Korea and a continuous catalytic
reformer at the Pascagoula, Mississippi, refinery.
• Commenced operations on two projects in Qatar, including an ethylene cracker located in Ras Laffan and a polyethylene and normal
alpha olefins complex located in Mesaieed.
• Restructured the refining and marketing business to improve operating efficiency, reduce costs and achieve sustained improvement
in financial performance. Completed the sale of businesses in Mauritius, Réunion and Zambia and 21 product terminals.
2011 Outlook
Expecting ongoing challenging industry conditions, Downstream will continue to focus on lowering operating costs and sustaining
reduced capital spending in order to improve efficiency and financial returns. Key objectives include the following:
• Continue to improve safety and refinery reliability.
• Streamline the company’s refining and marketing asset portfolio.
• Advance projects that improve refinery feedstock flexibility, high-value product yield and energy efficiency.
• Advance projects in the chemicals and base-oil manufacturing businesses that add capacity to serve key markets.
• Complete cost-reduction programs as part of the restructuring that was announced in 2010.
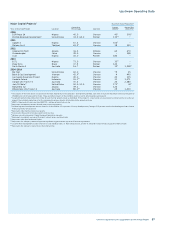
Downstream Financial and Operating Highlights
(Includes equity share in affiliates)
Dollars in millions 2010 2009
Segment earnings* $ 2,478 $ 473
Refinery crude oil inputs (Thousands of barrels per day) 1,894 1,878
Refinery capacity at year-end (Thousands of barrels per day) 2,160 2,158
U.S. gasoline and jet fuel yields (Percent of U.S. refinery production) 64% 65%
Refined product sales (Thousands of barrels per day) 3,113 3,254
Motor gasoline sales (Thousands of barrels per day) 1,221 1,275
Natural gas liquids (NGLs) sales (Thousands of barrels per day) 217 232
Number of marketing retail outlets at December 31 19,547 21,574
Refining capital expenditures* $ 1,577 $ 2,464
Marketing capital expenditures $ 246 $ 335
Chemicals and other downstream capital expenditures* $ 729 $ 737
Total downstream capital expenditures* $ 2,552 $ 3,536
* 2009 conformed to 2010 segment presentation.