Chevron 2010 Annual Report Download - page 42
Download and view the complete annual report
Please find page 42 of the 2010 Chevron annual report below. You can navigate through the pages in the report by either clicking on the pages listed below, or by using the keyword search tool below to find specific information within the annual report.-
 1
1 -
2
-
3
-
4
-
5
-
6
-
7
-
8
-
9
-
10
-
11
-
12
-
13
-
14
-
15
-
16
-
17
-
18
-
19
-
20
-
21
-
22
-
23
-
24
-
25
-
26
-
27
-
28
-
29
-
30
-
31
-
 32
32 -
 33
33 -
 34
34 -
 35
35 -
 36
36 -
 37
37 -
 38
38 -
 39
39 -
 40
40 -
 41
41 -
 42
42 -
 43
43 -
 44
44 -
 45
45 -
 46
46 -
 47
47 -
 48
48 -
 49
49 -
 50
50 -
 51
51 -
 52
52 -
53
-
54
-
55
-
56
-
57
-
58
-
59
-
60
-
61
-
62
-
63
-
64
-
65
-
66
-
67
-
68
 |
 |

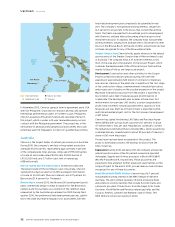
40 Chevron Corporation 2010 Supplement to the Annual Report
Upstream Operating Data
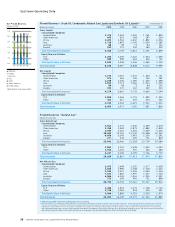
Net Liquids Production by
Country*
Percentage
United States 25.4%
Kazakhstan 15.1%
Nigeria 12.4%
Indonesia 9.7%
Angola 7.9%
Partitioned Zone 4.9%
Thailand 3.6%
United Kingdom 3.3%
Others 17.5%
*Includes equity share in affiliates.
0
2250
1800
1350
450
900
Net Liquids Production*
Thousands of barrels per day
* Includes other produced volumes
in 2006 to 2009.
0706 08 09 10
1,923
Affiliates
Europe
Australia
Asia
Africa
Other Americas
United States — Offshore
United States — Onshore
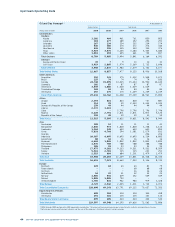
Net Liquids Production1,2,3 Year ended December 31
Thousands of barrels per day 2010 2009 2008 2007 2006
Consolidated Companies
United States
Alaska – Onshore 11 12 12 14 15
– Offshore 3 2 5 5 5
California 183 196 201 205 207
Colorado 10 9 10 10 10
Louisiana – Onshore 1 1 1 2 2
– Offshore 178 154 77 106 101
New Mexico 19 21 21 21 20
Texas – Onshore 66 71 76 77 79
– Offshore 4 3 4 5 6
Wyoming 7 7 7 7 8
Other states 7 8 7 8 9
Total United States 489 484 421 460 462
Other Americas
Argentina 31 33 37 39 38
Brazil 23 2 – – –
Canada 53 27 36 35 46
Trinidad and Tobago 1 1 – – –
Venezuela4 – – – – 3
Total Other Americas 108 63 73 74 87
Africa
Angola 152 141 145 171 156
Chad 27 26 28 31 34
Democratic Republic of the Congo 2 3 2 3 3
Nigeria 239 225 142 126 139
Republic of the Congo 23 19 11 7 11
Total Africa 443 414 328 338 343
Asia
Azerbaijan 28 28 28 60 46
Bangladesh 2 2 2 2 –
China 18 17 19 22 23
Indonesia 187 199 182 195 198
Kazakhstan 39 42 41 41 38
Partitioned Zone 94 101 103 109 111
Philippines 4 4 5 5 6
Thailand 70 65 67 71 73
Total Asia 442 458 447 505 495
Total Australia 34 35 34 39 39
Europe
Denmark 32 35 37 41 44
Netherlands 2 2 2 3 3
Norway 3 5 6 6 6
United Kingdom 64 73 71 78 75
Total Europe 101 115 116 128 128
Total Consolidated Companies 1,617 1,569 1,419 1,544 1,554
Equity Share in Affiliates
TCO 252 226 168 144 135
Petropiar (Hamaca prior to 2008) 28 26 34 39 36
Petroboscan5 25 24 27 28 7
Petroindependiente5 1 1 1 1 –
Total Equity Share in Affiliates 306 277 230 212 178
Total Consolidated Companies and Affiliates 1,923 1,846 1,649 1,756 1,732
Other Produced Volumes
Athabasca Oil Sands in Canada – 26 27 27 27
Boscan operating service agreement in Venezuela6 – – – – 82
Total Other Produced Volumes – 26 27 27 109
Total Worldwide 1,923 1,872 1,676 1,783 1,841
1 2006 through 2009 conformed to 2010 geographic presentation.
2 Net liquids production excludes royalty interests and a government’s
agreed-upon share of production under a PSC.
3 Net production of natural gas liquids:
United States 51 50 47 51 48
International 21 20 19 18 19
Total 72 70 66 69 67
4 Includes production from LL-652 through September 2006.
5 Joint stock company formed in October 2006.
6 Includes volumes through September 2006.