Chevron 2010 Annual Report Download - page 39
Download and view the complete annual report
Please find page 39 of the 2010 Chevron annual report below. You can navigate through the pages in the report by either clicking on the pages listed below, or by using the keyword search tool below to find specific information within the annual report.-
 1
1 -
2
-
3
-
4
-
5
-
6
-
7
-
8
-
9
-
10
-
11
-
12
-
13
-
14
-
15
-
16
-
17
-
18
-
19
-
20
-
21
-
22
-
23
-
24
-
25
-
26
-
27
-
28
-
 29
29 -
 30
30 -
 31
31 -
 32
32 -
 33
33 -
 34
34 -
 35
35 -
 36
36 -
 37
37 -
 38
38 -
 39
39 -
 40
40 -
 41
41 -
 42
42 -
 43
43 -
 44
44 -
 45
45 -
 46
46 -
 47
47 -
 48
48 -
 49
49 -
50
-
51
-
52
-
53
-
54
-
55
-
56
-
57
-
58
-
59
-
60
-
61
-
62
-
63
-
64
-
65
-
66
-
67
-
68
 |
 |

Chevron Corporation 2010 Supplement to the Annual Report 37
Upstream Operating Data
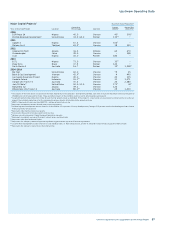
Major Capital Projects1 Maximum Total Production2
Ownership Liquids Natural Gas
Year of Start-Up/Project Location Percentage Operator (MBPD)3 (MMCFPD)3
2010
EGP Phase 3A Nigeria 40.0 Chevron 43
4 395
4
Perdido Regional Development5 United States 33.3-60.0 Partner 130
6,7 –
2011
Agbami 2 Nigeria 67.3 Chevron 100
8 –
Platong Gas II Thailand 69.99 Chevron 18 330
2012
Angola LNG Plant Angola 36.4 Affiliate 63 670
Chuandongbei China 49.0 Chevron – 558
Usan Nigeria 30.0 Partner 180 –
2013
EGTL Nigeria 75.0 Chevron 33
10 –
Papa-Terra Brazil 37.5 Partner 140 –
North Rankin 2 Australia 16.7 Partner 39
8 1,980
8
2014-2016
Big Foot United States 60.0 Chevron 75 25
Block B Gas Development Vietnam 42.99 Chevron 4 490
Gas Supply Expansion Project Nigeria 40.0 Chevron 43 215
Gendalo-Gehem Indonesia 55.111 Chevron 31 1,071
Gorgon LNG Trains 1–3 Australia 47.3 Chevron 20 2,580
Jack/St. Malo12 United States 50.0-51.0 Chevron 170
6 42 6
Mafumeira Sul Angola 39.2 Chevron 120 –
Wheatstone LNG Trains 1–2 Australia 80.0 13 Chevron 25 1,410
1 The projects in the table above are considered the most noteworthy in the company’s development portfolio, each with an expected maximum net daily production of
25,000 barrels of oil-equivalent or more. These and other projects in the portfolio are discussed in detail beginning on page 14.
2 Targeted maximum total production is total for each field or project except as footnoted. If the project is a new facility, an expansion of existing facilities or a phased
project, the indicated production is for the incremental volumes directly attributable to the project or phase.
3 MBPD = thousands of barrels per day; MMCFPD = millions of cubic feet per day.
4 Represents incremental volumes to total plant processing capacity.
5 Perdido Regional Development includes interests in Great White (33.3 percent), Silvertip (60.0 percent), Tobago (57.5 percent) and the Perdido Regional Host Shared
Producing facility (37.5 percent).
6 Represents total facility processing capacity.
7 Expressed in thousands of oil-equivalent barrels per day.
8 Volumes are not incremental. Project designed to maintain capacity.
9 Represents a weighted average of Chevron’s interest across multiple blocks.
1 0 Represents total plant outtake of liquids.
11 Represents the company’s ownership percentage following government approval of farm-out agreements.
12 Jack/St. Malo development includes interests in Jack (50.0 percent), St. Malo (51.0 percent), and the St. Malo Host Shared Producing facility (50.7 percent).
13 Represents the company’s ownership in the LNG facilities.