Albertsons 2002 Annual Report Download - page 38
Download and view the complete annual report
Please find page 38 of the 2002 Albertsons annual report below. You can navigate through the pages in the report by either clicking on the pages listed below, or by using the keyword search tool below to find specific information within the annual report.-
 1
1 -
2
-
3
-
4
-
5
-
6
-
7
-
8
-
9
-
10
-
11
-
12
-
13
-
14
-
15
-
16
-
17
-
18
-
19
-
20
-
21
-
22
-
23
-
24
-
25
-
26
-
27
-
 28
28 -
 29
29 -
 30
30 -
 31
31 -
 32
32 -
 33
33 -
 34
34 -
 35
35 -
 36
36 -
 37
37 -
 38
38 -
 39
39 -
 40
40
 |
 |

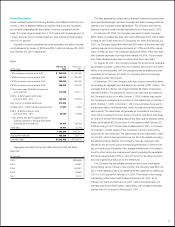
2002(b) 2001(c) 2000(d) 1999 1998(e)
Statement of Earnings Data (a)(f)
Net sales $20,908,522 $23,194,279 $20,339,079 $17,420,507 $17,201,378
Cost of sales 18,307,974 20,635,564 18,111,296 15,620,127 15,430,642
Selling and administrative expenses 2,037,771 2,042,259 1,705,003 1,382,212 1,365,327
Gain on sale of Hazelwood Farms Bakeries ——(163,662) ——
Restructure and other charges 46,300 171,264 103,596 ——
Interest, net 172,774 190,835 135,392 101,907 113,993
Equity in earnings and gain on sale of ShopKo ————(93,364)
Earnings before taxes 343,703 154,357 447,454 316,261 384,780
Provision for income taxes 138,168 72,392 204,513 124,923 154,023
Net earnings 205,535 81,965 242,941 191,338 230,757
Net earnings per common share – diluted 1.53 0.62 1.87 1.57 1.82
Balance Sheet Data (a)
Inventories (FIFO) $ 1,186,803 $ 1,490,685 $ 1,626,087 $ 1,195,217 $ 1,247,429
Working capital (g) 43,305 (115,062) (196,348) 188,000 286,800
Net property, plant and equipment 2,208,633 2,232,794 2,168,210 1,699,024 1,589,601
Total assets 5,824,782 6,359,980 6,495,353 4,265,949 4,093,010
Long-term debt (h) 1,875,873 2,008,474 1,953,741 1,246,269 1,260,728
Stockholders’ equity 1,916,693 1,793,495 1,821,479 1,305,639 1,201,905
Other Statistics (a) (f)
Earnings as a percent of net sales 1.15% 1.02% 1.14% 1.10% 1.01 %
Return on average stockholders’ equity 12.63% 12.57% 14.27% 15.24% 14.19%
Book value per common share $ 14.42 $ 13.55 $ 13.53 $ 10.82 $ 9.94
Current ratio (g) 1.03:1 0.95:1 0.92:1 1.12:1 1.20:1
Debt to capital ratio 54.1% 59.6% 60.0% 54.6% 56.9%
Dividends declared per common share $ 0.553⁄4$ 0.543⁄4$ 0.533⁄4$ 0.523⁄4$0.51
1⁄2
Weighted average common shares outstanding – diluted 133,978 132,829 130,090 121,961 126,550
Depreciation and amortization $ 340,750 $ 343,779 $ 277,062 $ 233,523 $ 230,082
EBITDA $ 916,027 $ 921,563 $ 799,842 $ 651,691 $ 638,821
EBITDA as a percent of net sales 4.38% 3.97% 3.93% 3.74% 3.71%
Capital expenditures $ 388,658 $ 511,673 $ 539,264 $ 346,390 $ 279,768
Notes:
(a) Fiscal 1998 contains 53 weeks; all other years include 52 weeks. Dollars in thousands except per share and percentage data.
(b) Fiscal 2002 net earnings include restructure and other items of $35.2 million or $0.27 per diluted share. This includes total pretax adjustments of $58.8 million, including $46.3 million of
restructure charges and $12.5 million in store closing charges recorded in the fourth quarter. The $46.3 million of restructure charges includes $16.3 million for additional efficiency initiatives
and $30.0 million of net adjustments to increase prior years’ restructure charges for increased lease liabilities. During the fourth quarter, the Company also recorded $12.5 million in store
closing reserves reflected in selling and administrative expenses. Earnings as a percent of net sales, return on average stockholders’ equity, and EBITDA have been adjusted to exclude
these transactions.
(c) Fiscal 2001 net earnings include restructure and other items of $153.9 million or $1.16 per diluted share. This includes total pretax adjustments of $240.1 million, including $171.3 million of
restructure and other charges related primarily to consolidation of distribution facilities, exit of certain non-core retail markets, and write-off of other items. The pretax adjustments also include
$17.1 million in cost of sales for inventory markdowns related to restructure activities and $51.7 million in selling and administrative expenses primarily for store closing reserves and provisions
for certain uncollectible receivables. Earnings as a percent of net sales, return on average stockholders’ equity, and EBITDA have been adjusted to exclude these transactions.
(d) Fiscal 2000 net earnings include a net benefit of $10.9 million or $0.08 per diluted share from the gain on sale of Hazelwood Farms Bakeries and restructure charges. This reflects total pretax
net adjustments of $60.1 million, which include a $163.7 million gain on sale of Hazelwood Farms Bakeries and $103.6 million of restructure charges related primarily to facility consolidation, non
core store disposal, and rationalization of redundant and certain decentralized administrative functions. Earnings as a percent of net sales, return on average stockholders’ equity, and EBITDA
have been adjusted to exclude these transactions.
(e) Fiscal 1998 net earnings include a net gain on the sale of ShopKo of $53.7 million or $0.42 per diluted share. Earnings as a percent of net sales, return on average stockholders’ equity, and
EBITDA have been adjusted to exclude this transaction.
(f) Information adjusted to include stock split in fiscal 1999.
(g) Working capital and current ratio are calculated after adding back the LIFO reserve.
(h) Long-term debt includes long-term debt and long-term obligations under capital leases.
Five Year Financial and Operating Summary
36