Albertsons 2002 Annual Report Download - page 25
Download and view the complete annual report
Please find page 25 of the 2002 Albertsons annual report below. You can navigate through the pages in the report by either clicking on the pages listed below, or by using the keyword search tool below to find specific information within the annual report.-
 1
1 -
2
-
3
-
4
-
5
-
6
-
7
-
8
-
9
-
10
-
11
-
12
-
13
-
14
-
 15
15 -
 16
16 -
 17
17 -
 18
18 -
 19
19 -
 20
20 -
 21
21 -
 22
22 -
 23
23 -
 24
24 -
 25
25 -
 26
26 -
 27
27 -
 28
28 -
 29
29 -
 30
30 -
 31
31 -
 32
32 -
 33
33 -
 34
34 -
 35
35 -
36
-
37
-
38
-
39
-
40
 |
 |

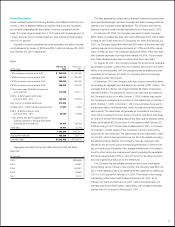
February 23, 2002 February 24, 2001 February 26, 2000
(In thousands) (52 weeks) (52 weeks) (52 weeks)
Cash flows from operating activities
Net earnings $ 205,535 $ 81,965 $ 242,941
Adjustments to reconcile net earnings to net cash provided by operating activities:
Depreciation and amortization 340,750 343,779 277,062
LIFO expense 143 4,991 8,253
Provision for losses on receivables 19,898 23,107 9,895
Gain on sale of Hazelwood Farms Bakeries ——(163,662)
Restructure and other charges 46,300 171,264 103,596
Deferred income taxes 76,360 (38,480) (21,041)
Other adjustments, net 1,382 829 2,032
Changes in assets and liabilities, excluding effect from acquisitions:
Receivables 103,389 (43,582) (58,887)
Inventories 304,779 135,402 (195,192)
Accounts payable (349,463) (66,824) 61,997
Other assets and liabilities 37,629 38,774 74,178
Net cash provided by operating activities 786,702 651,225 341,172
Cash flows from investing activities
Additions to long-term notes receivable (37,372) (69,875) (55,162)
Proceeds received on long-term notes receivable 47,794 69,439 52,101
Proceeds from sale of assets 89,504 48,179 374,714
Purchase of property, plant and equipment (292,927) (397,715) (407,947)
Business acquisitions, net of cash acquired ——(480,502)
Other investing activities (51,093) (30,389) (17,704)
Net cash used in investing activities (244,094) (380,361) (534,500)
Cash flows from financing activities
Net (decrease) increase in checks outstanding, net of deposits (77,764) (13,537) 23,529
Net (reduction) issuance of short-term notes payable (551,574) 2,526 472,670
Proceeds from issuance of long-term debt 218,014 60,000 594,485
Repayment of long-term debt (16,867) (171,692) (672,303)
Reduction of obligations under capital leases (25,988) (28,220) (28,376)
Net proceeds from the sale of common stock under option plans 19,453 457 2,381
Redemption of preferred stock ——(5,908)
Dividends paid (74,024) (72,244) (66,932)
Payment for purchase of treasury stock (32,083) (48,678) (122,906)
Net cash (used in) provided by financing activities (540,833) (271,388) 196,640
Net increase (decrease) in cash and cash equivalents 1,775 (524) 3,312
Cash and cash equivalents at beginning of year 10,396 10,920 7,608
Cash and cash equivalents at end of year $ 12,171 $ 10,396 $ 10,920
Supplemental Cash Flow Information
The Company’s non-cash investing and financing activities were as follows:
Leased asset additions and related obligations $ 95,730 $ 113,958 $ 131,316
Acquisitions:
Fair value of assets acquired $ —$ —$1,951,004
Cash paid ——481,861
Common stock issued ——457,502
Liabilities assumed ——1,011,641
Interest paid $ 184,719 $ 213,572 $ 138,415
Income taxes paid $ 102,123 $ 75,266 $ 245,177
See notes to consolidated financial statements.
Consolidated Statements of Cash Flows
23